


Technical analysis is used when a trader predicts the future price of an instrument based on historical price data. This investment strategy assumes that history will repeat itself and will do so in recognizable patterns. Using TA will not guarantee your success in trading, but it can give you a way to measure price movement on your chart, and give you hints and ideas to a potential trade.
If you find you don’t know what a term means on your trading journey, try a search on Investopedia.
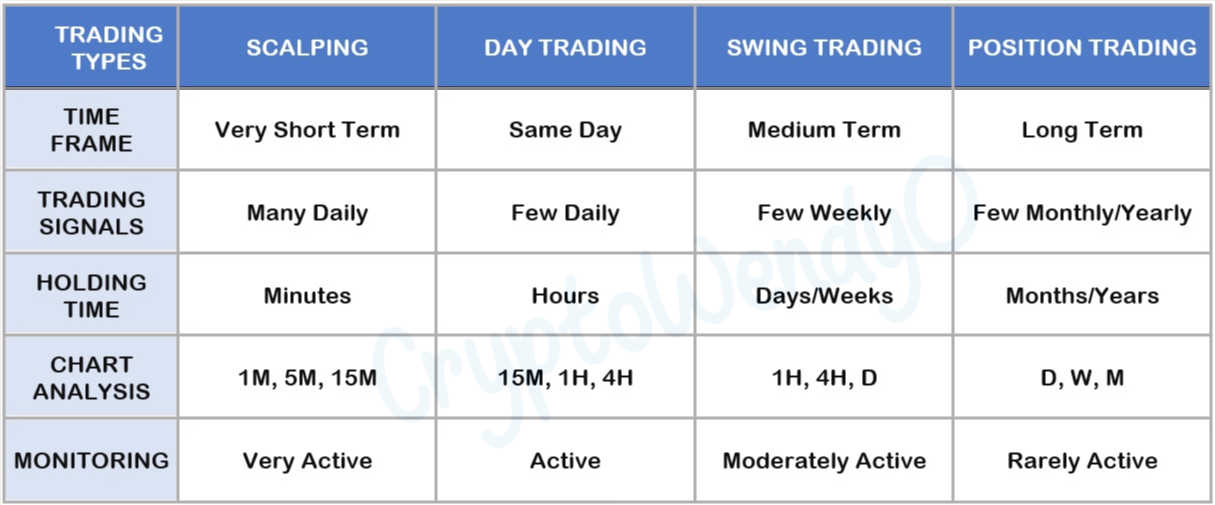
Before you start trading you should decide what type of trader you are first.
If you find it hard to hold a position for extended periods of time and/or would prefer to make a profit almost immediately after you open a trade, you may want to look into becoming a scalp trader. Scalpers typically only hold trades for a matter of minutes. Scalpers make smaller gains but take more trades throughout the day, and those small gains add up to large gains if profitable.
If you are uncomfortable with the intensity of taking fast paced trades and do not like the idea of holding a position overnight, then becoming a day trader might be your best bet. Day traders make their profits from the intraday movements in the market and close out their positions before or at then end of the trading session.
A trader that swing trades will use a strategy that involves making trades over the course of a few days, weeks, or months. Both day trading and swing trading require time, but swing trading requires much less screen time because a swing trader’s time horizons are much longer and are not focused on the smaller moves as much. Swing trading is very beneficial for the beginner traders who may have a day job but still want to get involved in the market and learn.
A position trader can also be referred to as an investor. These types of traders typically will hold onto an asset for long periods of time such as months or years. An investor will most likely not let daily price action or market news influence their decision to sell an asset. They are focused on the long-term outcome and usually do more research on an asset before they choose to invest in it.
Before an aspiring trader starts learning how to trade, it is more important to learn about risk management and how it applies to your trading system.
Risk management refers to the process of a trader keeping their losses under control. Risk management can help to prevent a trader from blowing their account and losing everything. Whether you are a beginner trader or a seasoned veteran, risk management must be applied to your trading system.
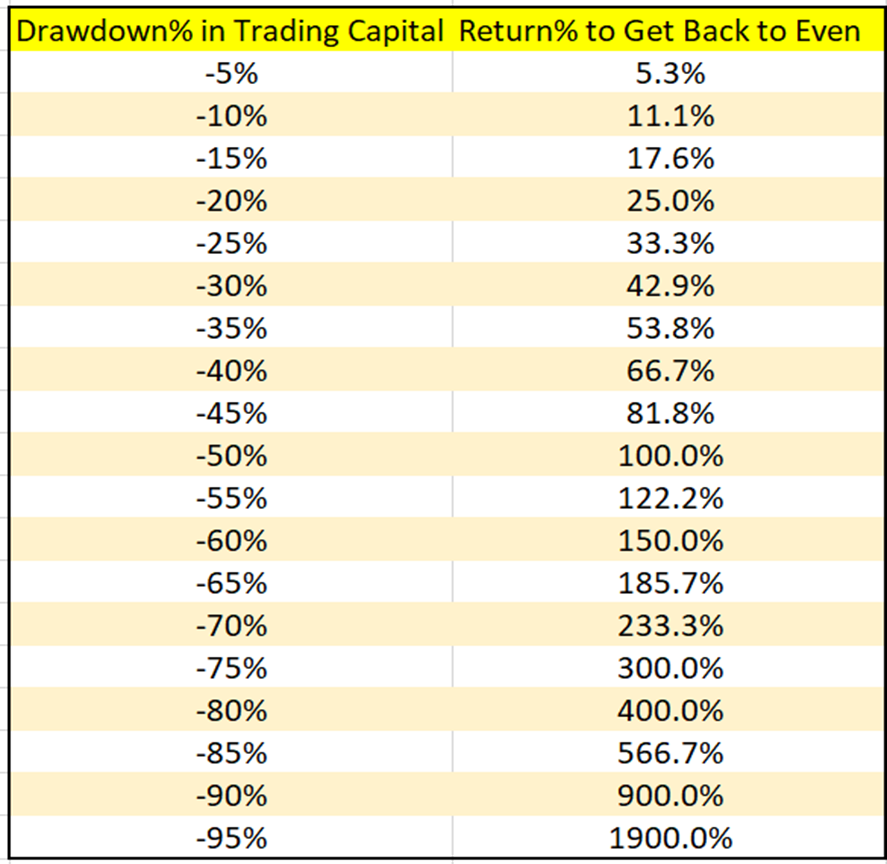
This chart shows how drawdown works
Did you know that if you lose 5% of your trading capital that it takes more than 5% to gain your money back?! It actually takes 5.3% just to break even! Losing 10% on a single trade would require 11.1%.
A 50% loss would require you to double your money and make a 100% gain just to make it back to break even! Therefore, we must be careful with our trading capital. Survival is the most important thing a trader should focus on because it allows them to keep trading and catch future opportunities.
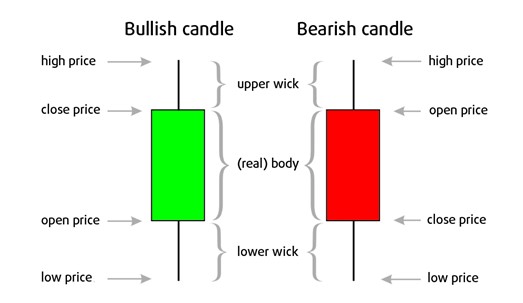
After learning risk management, the very first thing a trader should learn is the anatomy of a candle stick and how to interpret them. Japanese candlesticks are comprised of an upper body, a lower body, an upper wick, and a lower wick.
Typically, a GREEN candle represents a bullish candle and means that the price closed higher than it started out for the day (number go up). A RED candle represents a bearish candle and means that the price closed lower than it opened at for the day (number go down).
The number one thing I would recommend to anyone new trying to learn how to trade is how to identify support and resistance on a chart. In my opinion, this is where everyone should start. Support acts as a floor for price and resistance acts as a ceiling for price. Using support and resistance will allow you to anticipate the direction price will move when it interacts with those levels. There are traders who use nothing but support, resistance, and price action and are very profitable with this method.
One thing that I think handicaps a lot of new traders and confuses them is when they try to learn a new indicator every day. Your goal after learning support and resistance and mastering it should be to fully understand any new indicator that you add to your arsenal. Even if you were to fully understand fifty new indicators and have them all down to a science, it would still only cause you to have analysis paralysis and send you mixed signals. Pick a few indicators (5 or less in my opinion) and master those.
The market is not there to GIVE you money.
This is why we call it TAKING profit.
In the last section we talk about profit taking and how to do it. Taking profit is usually a great feeling, but sometimes we will let our greed take over by continuing to hold on just a little longer and before we know it the market has completely reversed on us. Remember, it is extremely rare to catch the absolute bottom and absolute top of a move.
The best way to take profit is with a trailing stop loss (If trading) or to cash out in increments (If investing). For example, if you were trading an asset and wanted to realize some of your gains you could take 25%-33% of your gains out every time price reached one of your targets. Another example would be for a Bitcoin hodler to cash out a set percentage of their portfolio at every $5k-$10K increment.
The name of the game is to make money and the money is not made until you REALIZE those gains and deposit it into your account. I don’t know about you but I personally prefer small gains but still being in profit versus seeing no gain at all and having fun staying poor lol.
These are what I feel are the most critical areas to focus on when trading. Hopefully, this guide helps you in your journey of becoming a trader or at least it points you in the right direction!