


Last week on Thursday Binance stated that a cross-chain bridge linking with its BNB chain was targeted by hackers, enabling them to move BNB tokens off the network. In total the hackers were able to withdraw 2 million BNB tokens which at the time had a value of about $570M.
Binance said it had worked with network validators to pause the creation of new blocks on BSC and suspended all transaction processing while a team of developers investigated the breach. The hack was caused by a bug in the bridge’s smart contract which enabled hackers to forge transactions and send money back to their crypto wallet.
On Friday morning, the value of BNB dropped a little more than 3% to around $285 per coin. Since then Binance’s CEO Changpeng Zhao stated, “The issue is contained now. Your funds are safe. We apologize for the inconvenience and will provide further updates accordingly.” The BNB Chain has since resumed operations.
https://www.tradingview.com/x/hCpIb96L/
https://www.tradingview.com/x/wp5RQk4f/
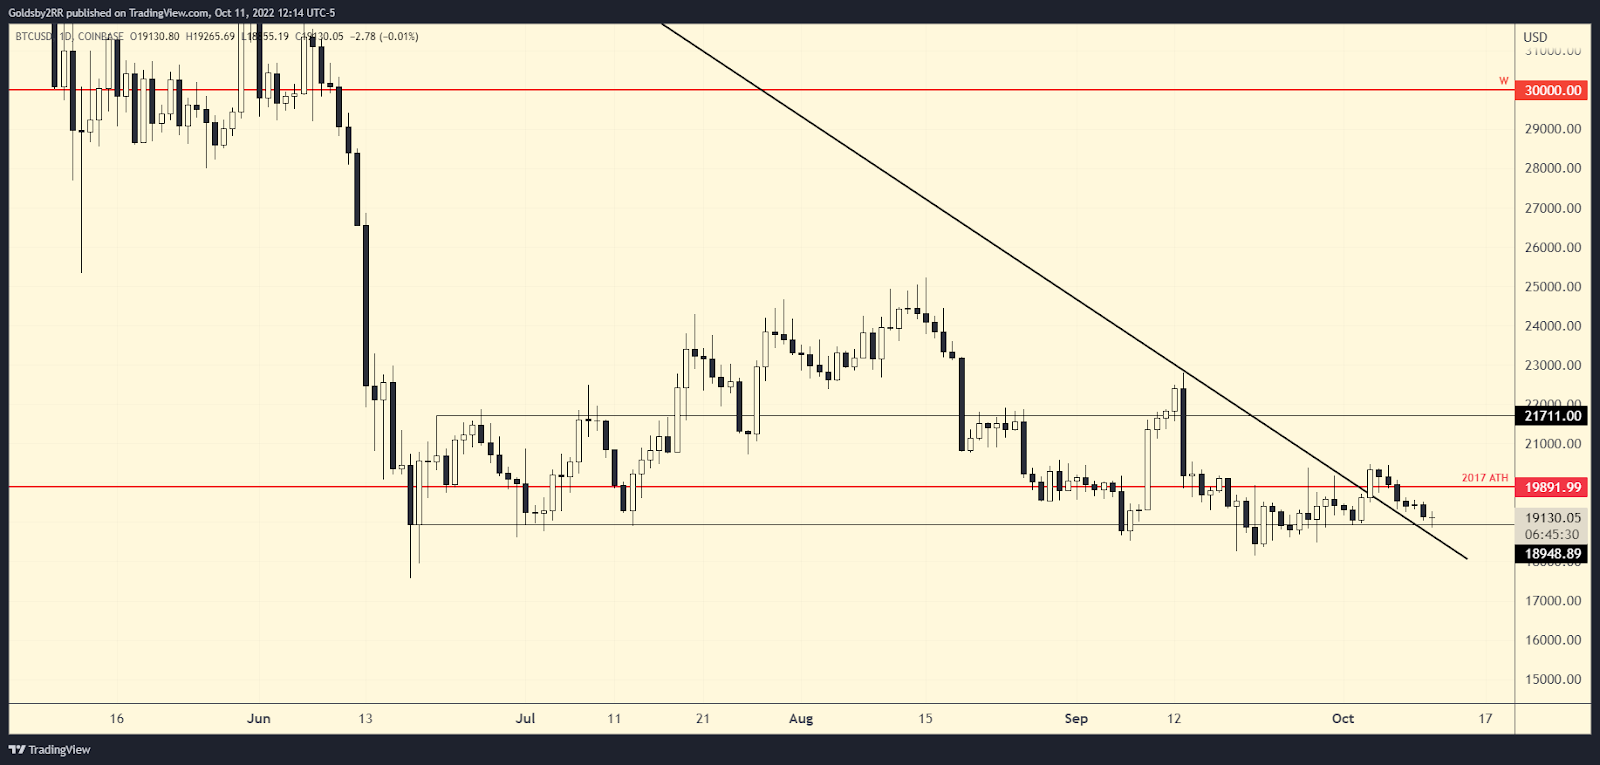
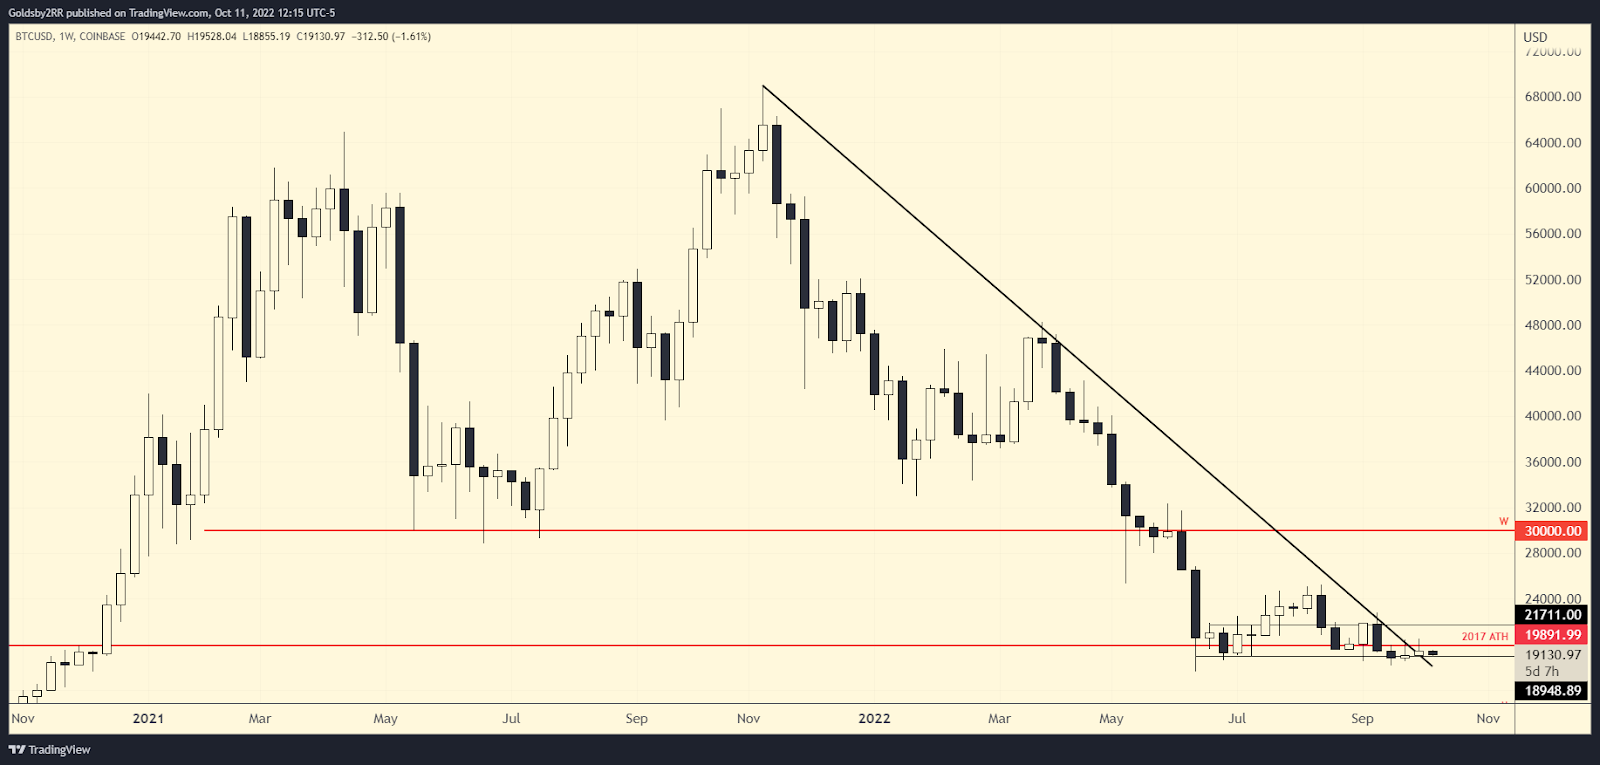
At the time of writing, bitcoin is priced at $19.1k and has found its way back down to the bottom of the range support. In last week’s article I mentioned the importance of a weekly close over the diagonal trendline resistance and while BTC did close over the level on the weekly timeframe, the follow through has been a bit lackluster.
Normally when price breaks out from long multi week downtrends such as the one pictured in the charts you get a strong impulse but this has not been the case which leads me to believe that is a sign of weakness. For now as long as BTC can maintain the range support then we must still assume that support will do its job.
Bitcoin maintains price over the trendline and range support level and I believe there is still a chance to revisit the range high located at $21.7k
Bitcoin loses the trendline and/or the $18.9k range support on a daily closing basis and either $16k or $14k is the next area to watch as support.
https://www.tradingview.com/x/QANmoJMj/
https://www.tradingview.com/x/ZtbuXJfh/
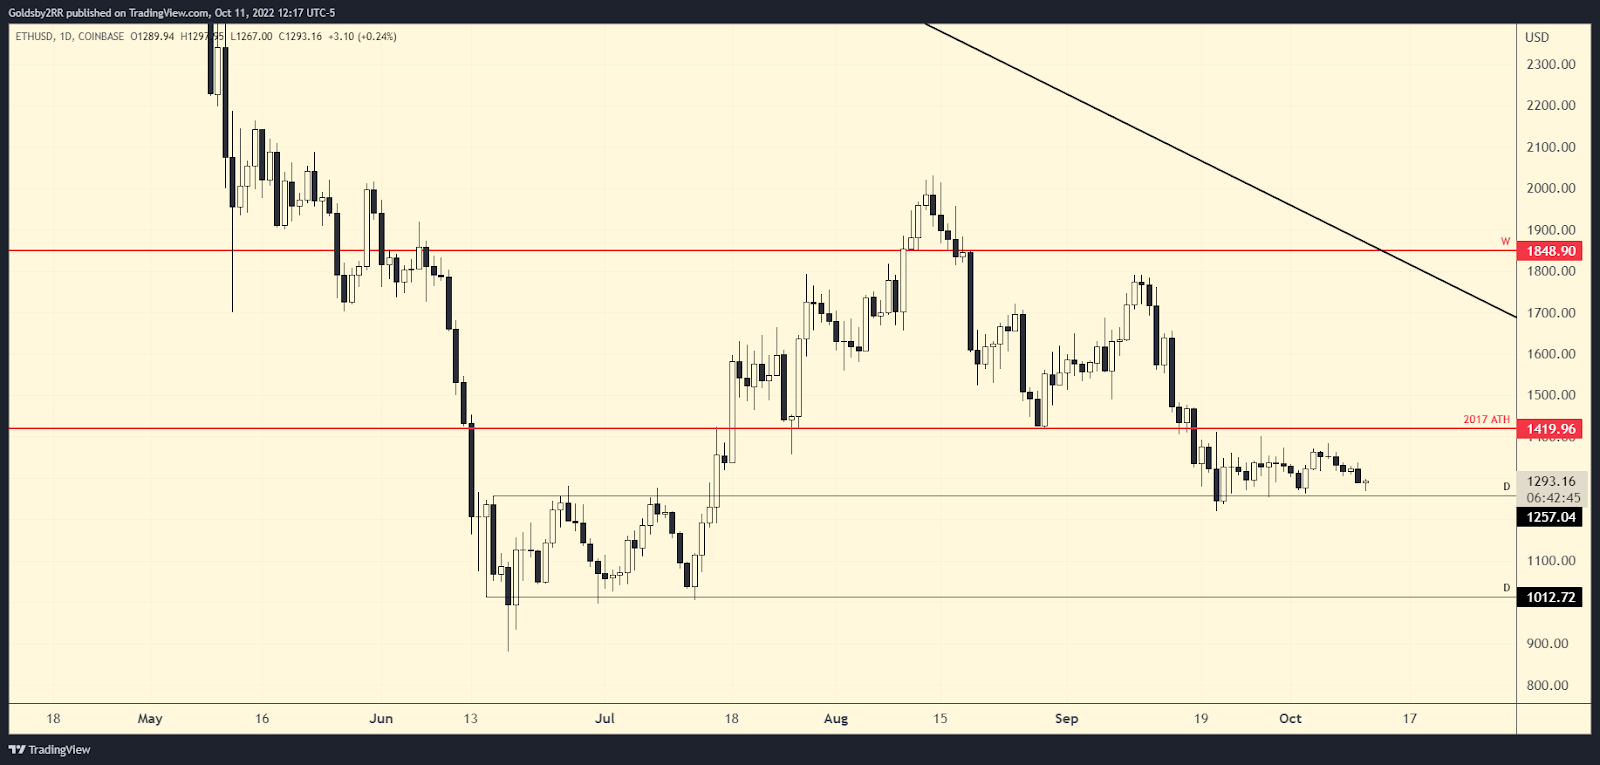
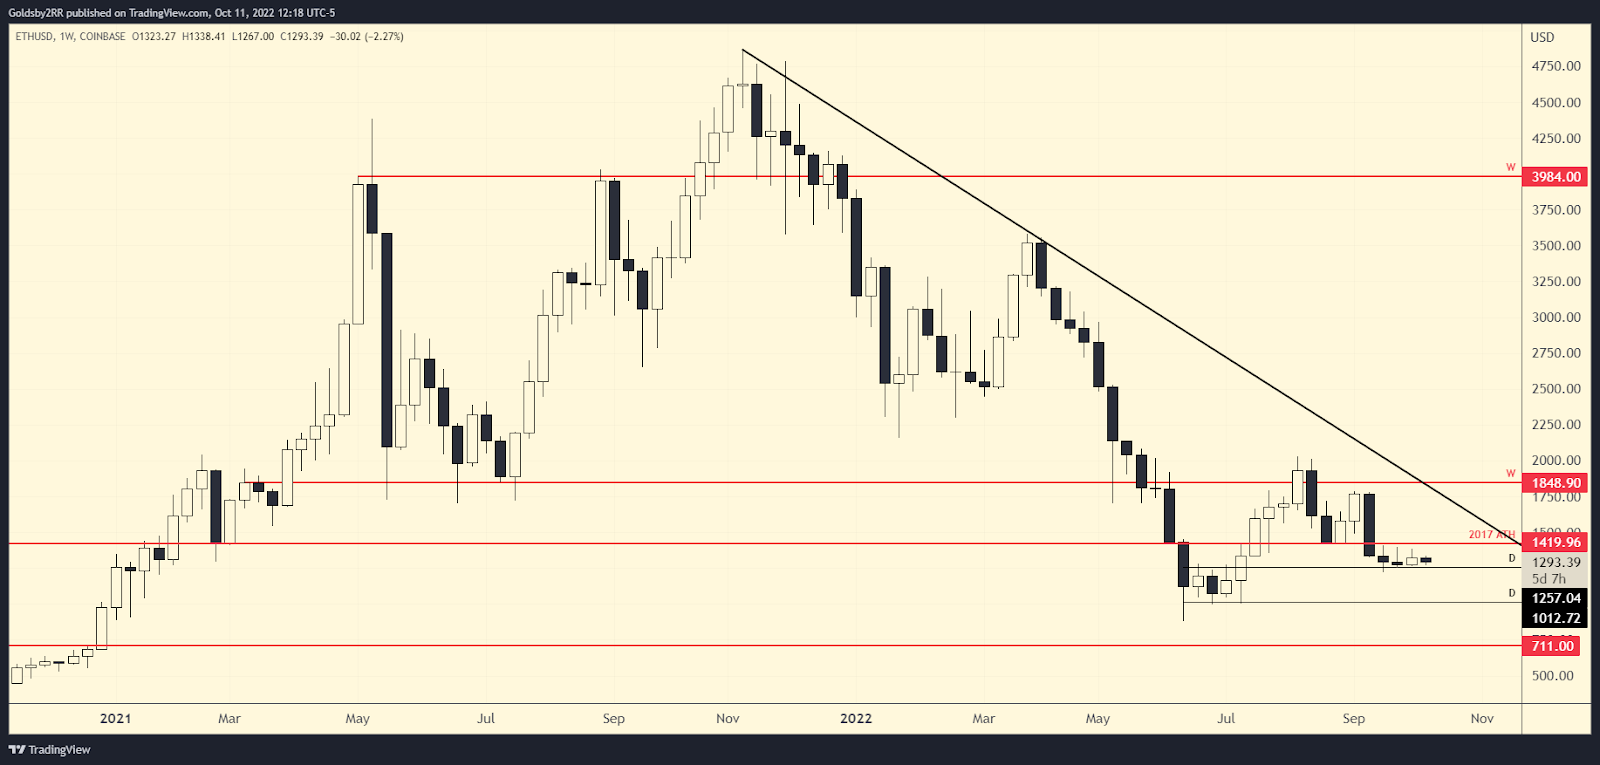
At the time of writing, Ethereum is trading at about $1290, and has managed to stay in its current range for nearly 3 weeks. Just below price is the support level located at $1250 and just above is the resistance level at about $1420 which is also the previous cycle’s ATH.
Just above that level is also a weekly area of resistance located at $1.8k. If price can manage to reclaim the prior ATH level on a daily closing basis, the next area to target would be the weekly level at $1.8k.
Ethereum reclaims the prior $1.4k 2017 ATH level and the next area to watch for is the weekly $1.8k resistance.
Ethereum loses the $1.2k level and the next area of support should fall near the $1k handle.