


The market is not there to GIVE you money.
This is why we call it TAKING profit.
https://www.tradingview.com/x/AMbi1zTa/
https://www.tradingview.com/x/vA6r2qDp/
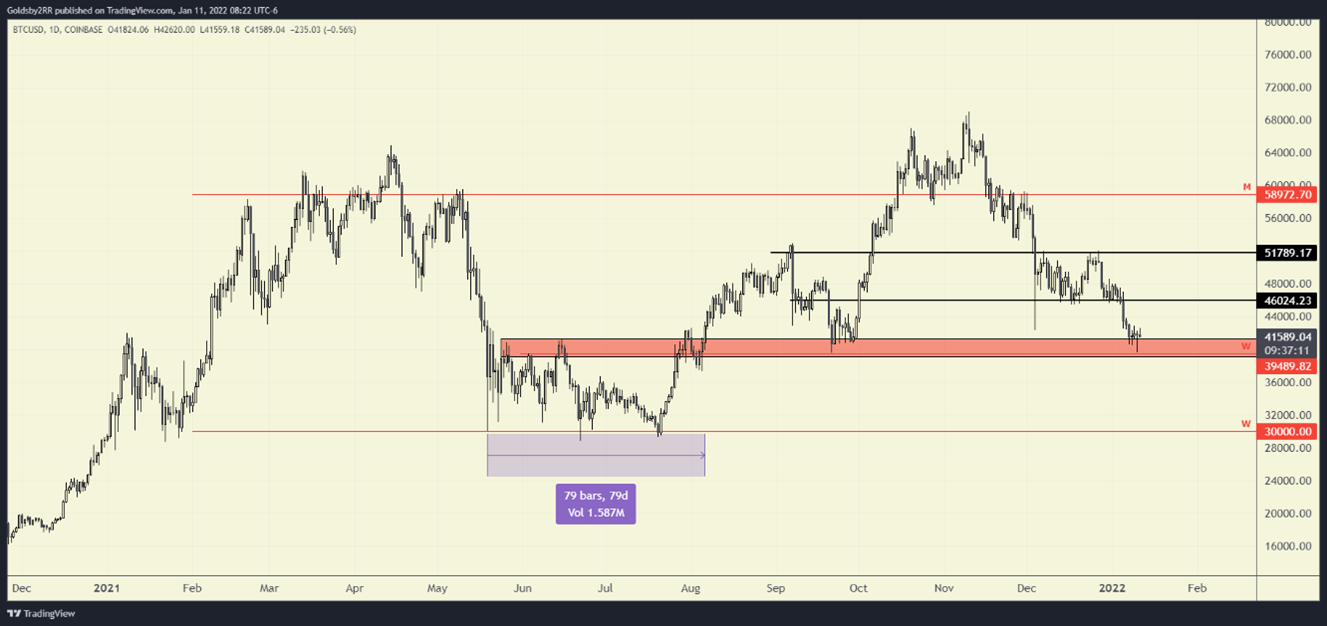
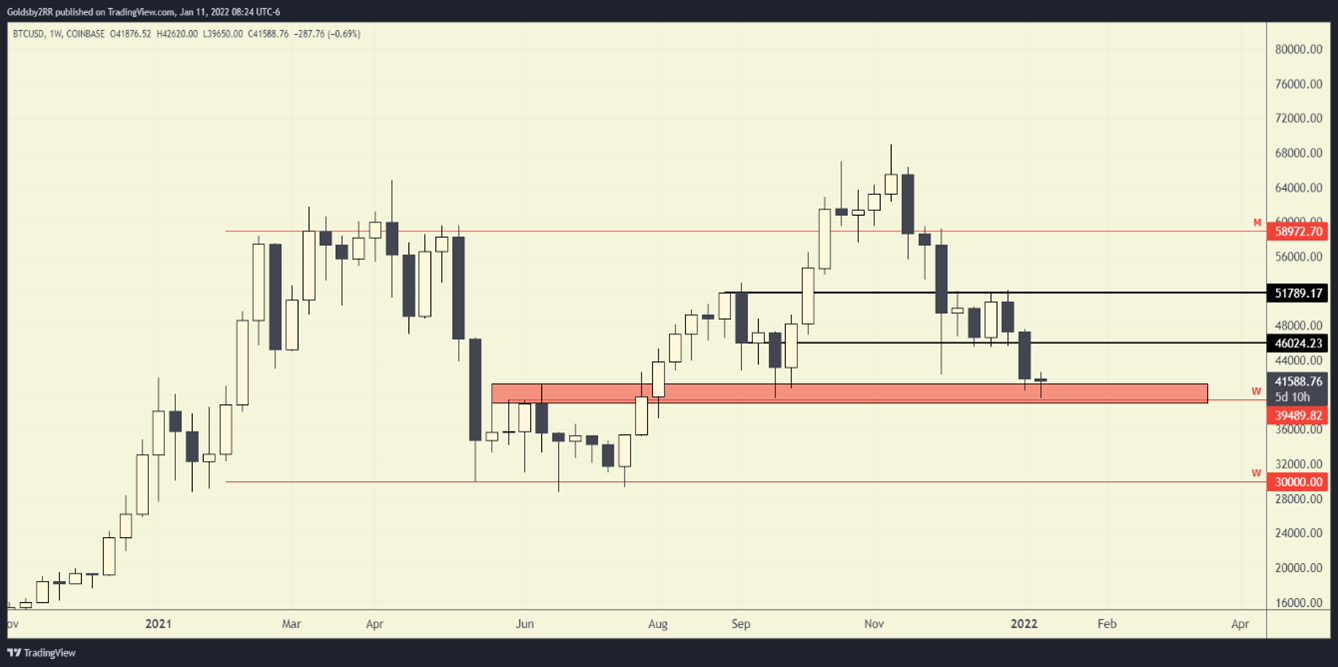
In last week’s article we mentioned Bitcoin needing to hold its weekly support at $40K to remain bullish and technically, anywhere between $40k – $42k is strong support for $BTC. At the time of writing, Bitcoin is sitting right on top of support just under $42k. When we drop down to the daily timeframe, we can see that $BTC tested the $40k level and gave us a daily candle that put in a low of exactly $39,650k. Since then, price has been reluctant to bounce from this key level which could imply that buyers are unwilling to step in. This is an important support to hold in my opinion, because of how long it took (77 days) Bitcoin to break out of this range in summer 2021. I think that revisiting this range would put Bitcoin back in the same type of monotonous environment it experienced last year.
Bitcoin bounces from $40k – $42k support area and reclaims the $46k level.
Bitcoin does not hold at $40k, and then we look for either $35k or $30k as the next level of support.
https://www.tradingview.com/x/Qb6Gd4pK/

https://www.tradingview.com/x/DJqCIzlj/
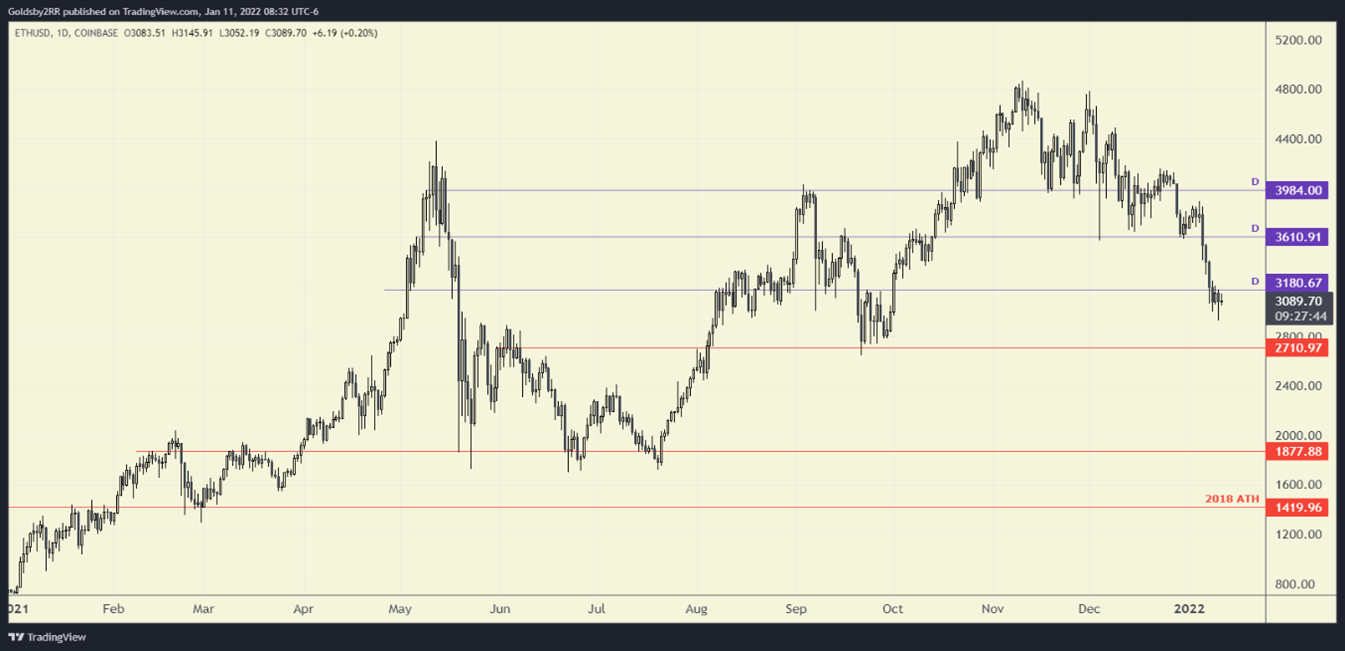
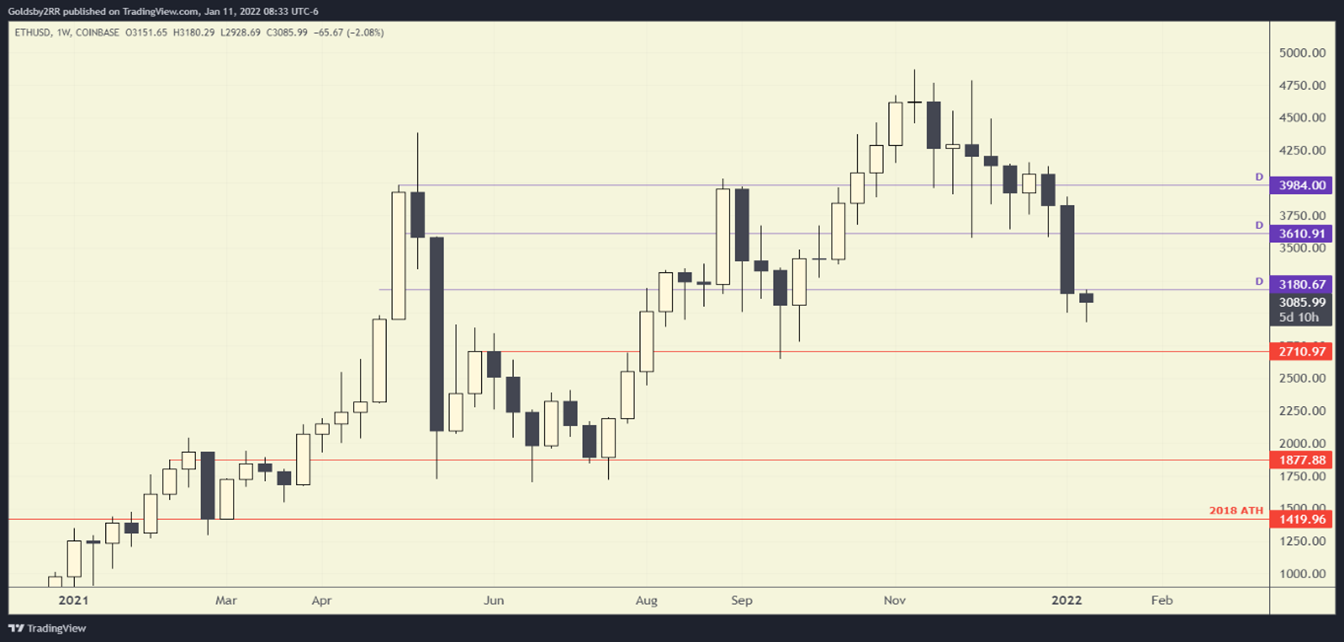
Ethereum’s price action is very similar to that of Bitcoin’s in the way that it is also sitting near support. When dealing with technical analysis it is important to remember that levels can sometimes be subjective and not everyone will always have the exact same levels marked out, thus the real edge lies within being able to practice great risk management. In my case my system is telling me that Ethereum has lost its daily support at the $3.1k area and may head lower. If it does head lower, the next support area would be around $2.7k
Ethereum reclaims the $3.1k level on the daily time frame and then attacks the $3.6k resistance level.
If the $3.1k level cannot be reclaimed, we should target the next support area around $2.7k
https://www.tradingview.com/x/fsiR4arY/
https://www.tradingview.com/x/KLC5jma0/
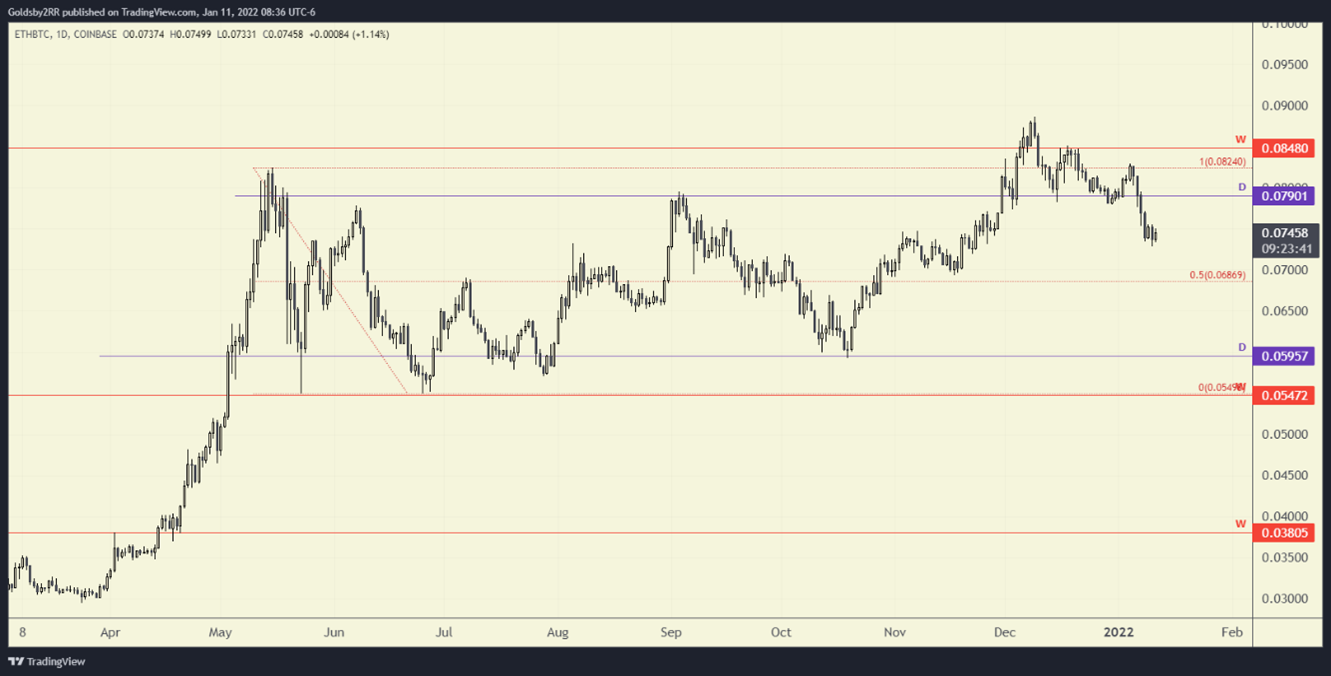
It has been a few weeks since we last covered ETH/BTC, but in a nutshell, ETH/BTC has deviated above its range the same way that BTC/USD and ETH/BTC have deviated above their range. ETH/BTC looks to be gravitating back to the midpoint of the range at 0.068 BTC. If this level does not hold and give us a push higher, I expect for the lower end of the range (0.059 BTC) to eventually be tested again. This could take weeks or even months to play out, but it is something to keep in the back of your mind for this chart in the event that we do not reclaim the top of the range or lose the midpoint level.
Ethereum reclaims the 0.079 BTC daily level.
Ethereum loses its current level, and we revisit the midpoint of the range or go lower.