


https://www.tradingview.com/x/4TodClwD/
https://www.tradingview.com/x/yFlPpMbk/
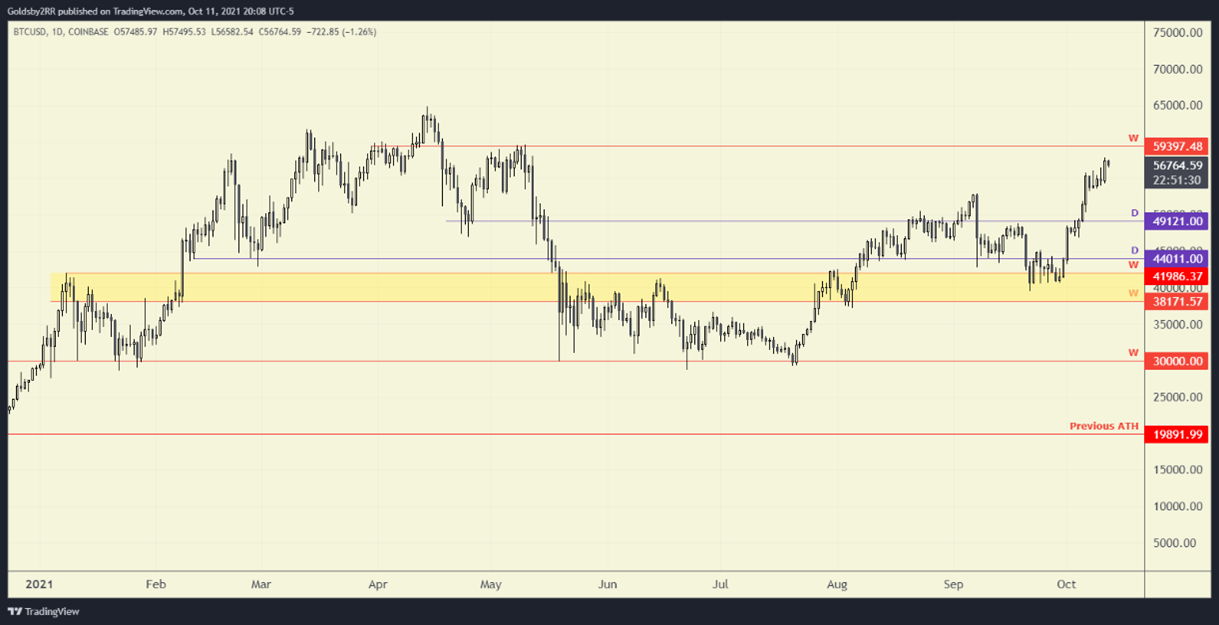
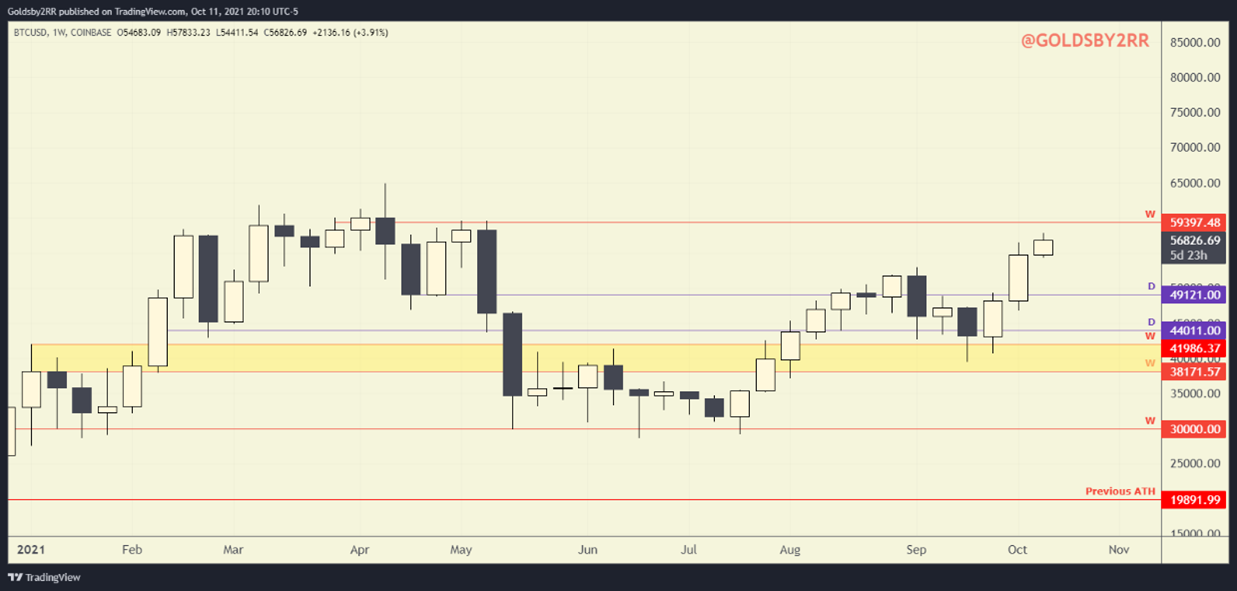
At the time of writing, Bitcoin is approximately $57k and is approaching the LAST major resistance located at about $59.4k – $60k. I personally do not expect for this resistance to be broken on the first attempt, and I think that price will most likely have a couple of failed attempts on the daily timeframe before we overcome this last major level. There will be no easy leveraged long trades to take at this point for Bitcoin and until we cross this resistance, I expect volatility in both directions from $BTC.
Bitcoin closes above the last major resistance located around the $59k – $60k level on the weekly timeframe, goes back into price discovery, and creates new all-time highs.
Bitcoin gets rejected from the $60k level and heads back down to the $53k – $49k area. (This scenario would temporarily destroy the value of altcoins)
https://www.tradingview.com/x/z71gUfOo/
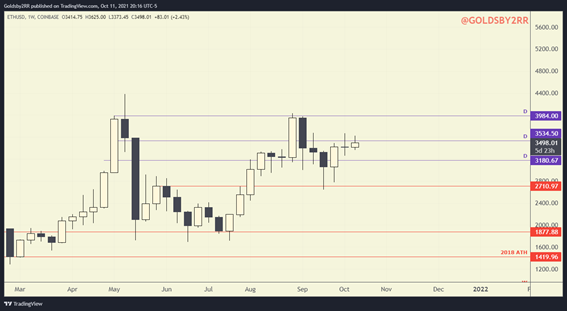
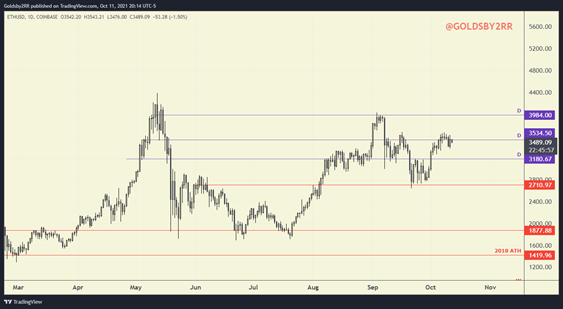
Last week Ethereum was approximately $3400 and this week we are currently still chopping around in the same price range. Unfortunately, Ethereum is still at the mercy of Bitcoin and even the smallest drop in price from Bitcoin could generate a significant move down for Ethereum due to the market being more Bitcoin focused right now (the next section of this article talks more about this topic). For now, the level to overcome on $ETH/USD is $3500, although I do not expect altcoins to perform strongly over the next few weeks.
Ethereum reclaims the $3500 area on a daily closing basis and attempts to take another stab at the $4000 area once again.
A weekly close below the $3.5k area and I would look for the $3.3k – $3.2k area to hold up as support. (Beware of trading altcoins in this current Bitcoin focused market).
https://www.tradingview.com/x/SZ4luBuA/
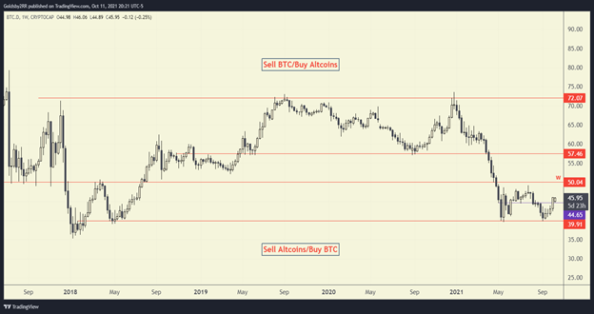
This section of today’s article is dedicated to gaining an understanding of the Bitcoin dominance chart ($BTC.D). Have you ever noticed times when the market is more altcoin focused and Bitcoin barely moves at all? What about times when $BTC is the star of the crypto show and altcoins only seem to go down in value or sideways at best? The Bitcoin dominance chart is used to help you time the market better and it is used to determine whether you should be focused more on Bitcoin or more focused on altcoins.
When dominance is high that means that more money has been focused into Bitcoin than altcoins and the altcoin market is not performing strongly. When Bitcoin dominance is low that means that Bitcoin is going sideways and/or altcoins are the focus. When dominance is high, you should probably stop trading $BTC and start trading altcoins, and when dominance is low you should sell your altcoins and start buying $BTC.
If you look closely at the dominance chart shown above you will notice that in the beginning of 2021, you can see a sharp move down in dominance. If you participated in crypto in the beginning of 2021 you will remember that this was an extremely exciting time for altcoins, and they were the focus of the market. Right now, we are currently at the opposite side of the range so I would expect for Bitcoin to be exciting in the coming weeks.