


https://www.tradingview.com/x/t9kKgP62/
https://www.tradingview.com/x/Obbw5f4G/
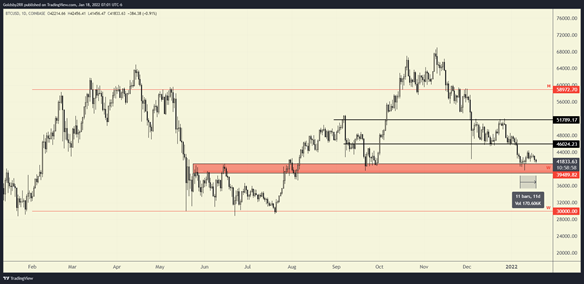
Bitcoin has remained at nearly the same price as it was since our last weekly analysis and has found itself going sideways from support to resistance in a very tight range (hence the term crab). At the time of writing, Bitcoin is priced at about $41.5k. As I mentioned last week, $38k – $42k is expected to be strong support, but if support were to fail the next area of interest would be either the $35k area or the $30k area. My personal recommendation is that unless you are a profitable scalp trader and have an edge in this environment, sitting on your hands and waiting for better opportunities is most likely the best trade to take.
Bitcoin bounces from $40k – $42k support area and reclaims the $46k level.
If Bitcoin loses support at $38k, the expected area of support would either be around the $35k or $30k level.
https://www.tradingview.com/x/olTKPtS1/
https://www.tradingview.com/x/KhHs9bLc/
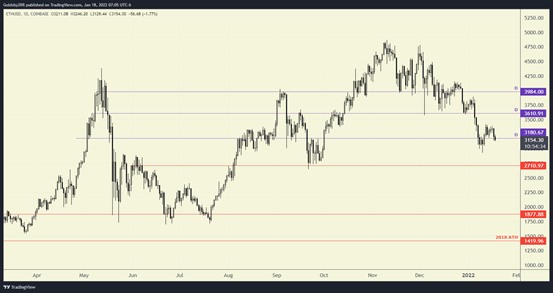
Ethereum is moving in a similar fashion to Bitcoin once again and has been chopping back and forth within a small $200 range. At the time of writing, Ethereum is priced at about $3.1k and seems to be sitting right on top of its daily support. For now, we should expect for this area to hold up as support but if not, the next areas of interest for me are located at $2.7k and $2.3k.
Ethereum pushes away from the $3.1k level on the daily time frame and then we aim for the $3.6k resistance level.
If the $3.1k level cannot be maintained, our first level of interest should be around the $2.7k area.
https://www.tradingview.com/x/vgR1FQs2/
https://www.tradingview.com/x/dDuCDQR1/
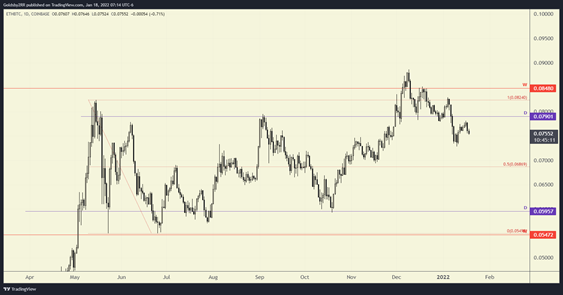
Last week when we talked about ETH/BTC we mentioned that it deviated from its range high. Usually when a coin deviates from its range low or range high and a level is reclaimed, the target is usually the opposite end of the range. At the time of writing, one Ethereum is equivalent to 0.075 BTC. This chart looks to be gravitating back to the midpoint of the range at 0.068 BTC. If this level is not maintained, I expect for the lower end of the range (0.059 BTC) to eventually be tested again. As I already mentioned, this could take weeks or months to materialize, but it is an idea to keep in the back of your mind and be aware.
Ethereum reclaims the 0.079 BTC daily level.
Ethereum loses its current level, and we revisit the midpoint of the range or head towards the range low.