


https://www.tradingview.com/x/968OL05K/
https://www.tradingview.com/x/AXRbX5Bu/
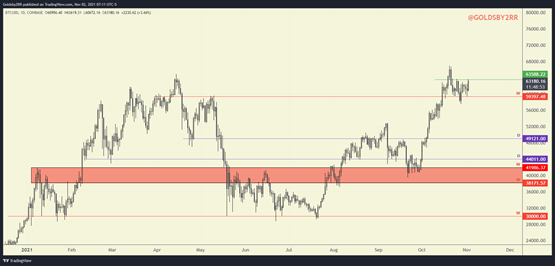
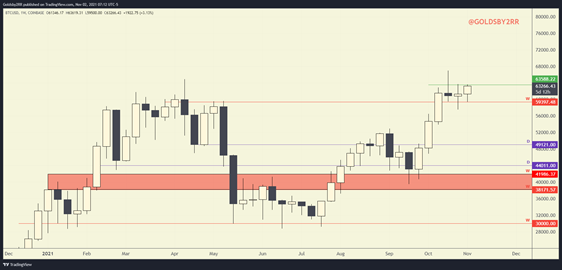
At the time of writing one Bitcoin is currently worth $63k. Bitcoin has spent a few days chopping around near its all time high. A very short term/minor resistance level that I have noticed is located right above today’s daily candle at $63588 (see green line). If this minor resistance can be broken, I believe Bitcoin will be back on the move up.
Bitcoin gives a daily close over the $63588 resistance and pushes beyond the last ATH.
Bitcoin loses the weekly support level. Losing this level would turn it back into resistance and I would look for $53K – $55K to hold as support.
https://www.tradingview.com/x/XodHldrS/
https://www.tradingview.com/x/KUgFY4Va/
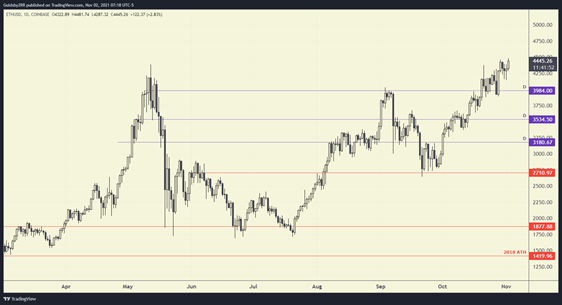
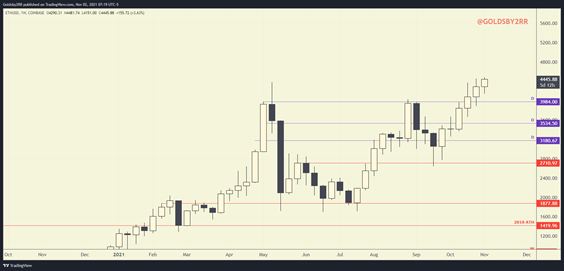
At the time of writing, one Ethereum is worth more than it has ever been at about $4450. In the last article I mentioned that while Bitcoin had retested its last weekly resistance level as support, Ethereum had not yet done the same. Last week Ethereum finally gave the retest of the weekly level that I expected to hold as support at $3.9k. Bulls defended the level and because the level could not be penetrated, the path of least resistance for Ethereum was up.
Ethereum maintains price over the $3.9k level and stays in up only mode. A daily close at this current price would be very bullish for Ethereum in my opinion.
ETH/USD losing the $3.9k area would be the bearish scenario. If we lost this area, I would expect for $3.5k – $3.7k area to hold up as support.
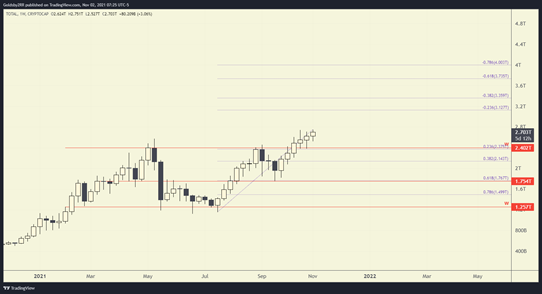
Total market cap is the market cap of all cryptocurrencies combined. The Total market cap chart displays the market cap of Bitcoin, Ethereum, and the top 125 altcoins by market cap all in one single data point. The total market cap can be an effective gauge to measure how strong/weak the crypto space is in general and how everything is trading as a whole.
https://www.tradingview.com/x/WM8kS35S/
Based on the total market cap chart, there was weekly resistance found at $2.40 Trillion dollars. The level was flipped in October and was successfully retested as support. Based on the Fibonacci extension, it suggests that the next level of resistance could be found at the -0.236 point (3.127T) or the level right above it at the -0.382 point (3.359T). We will have to revisit this chart in the coming weeks to see how this idea plays out.