


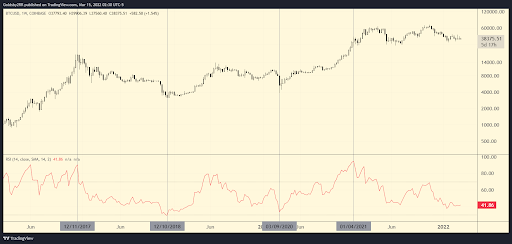
Relative strength index, also known as RSI, is a momentum indicator used to determine if an asset’s price is in overbought or oversold conditions. The indicator is displayed with a line graph that moves back and forth between two extremes ranging from 0 to 100. An asset is considered overbought when the RSI is at or above 70, and is considered oversold when the RSI is at or below 30. Generally, when RSI surpasses the 30 level, it is a bullish signal. A slide below 70 could also be interpreted as a bearish signal.
The RSI will rise as the number of positive closes increases, and will fall as the number of positive closes decreases. During an uptrend, RSI can stay in an overbought range for extended periods of time and in a downtrend RSI can be oversold for longer periods of time.
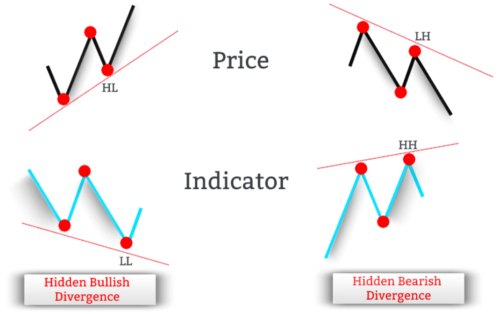
Divergences occur when the indicator moves in the opposite direction of price. A bullish divergence is when RSI is creating higher lows while price is creating lower lows. A bearish divergence occurs when RSI is creating lower highs while price is making higher highs.
Examples of RSI levels at the extremes:
Jan 2017 – Blow Off Top
Dec 2018 – Bear market bottom
March 2020 – March Covid Crash
Jan 2021 – Peak Euphoria – RSI level at 95
Divergence Example
https://www.tradingview.com/x/pf8Qhofp/
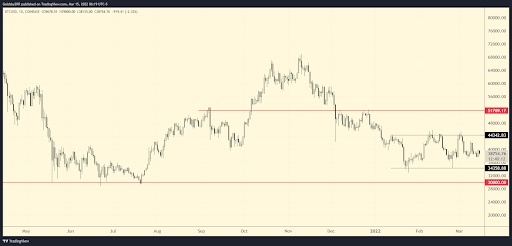
At the time of writing, Bitcoin is priced at about $38.7k and is still range bound at the moment. The range resistance is located at about $44k and the range support is located at about $34k. Last week I mentioned the lack of volatility due to indecisiveness in the market. The question that investors/traders are asking is when will the market start moving and which direction will price move next. While I do not know which direction it will move, I can say that volatility will pick up when the range is broken to either the upside or the downside. If the $34k range support is broken I believe $30k or lower comes next, and if the range resistance is broken I believe $50k or higher should be the next target.
Bitcoin maintains range support at 34k and/or breaks the $44k range resistance.
Bitcoin loses range support at $34k and we look for $30k or lower to act as support.
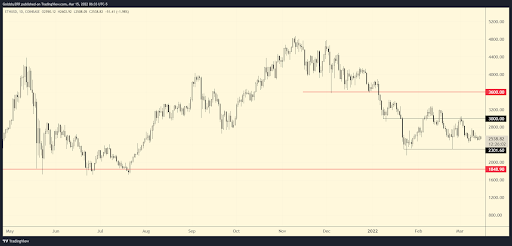
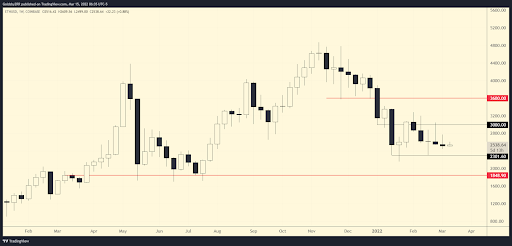
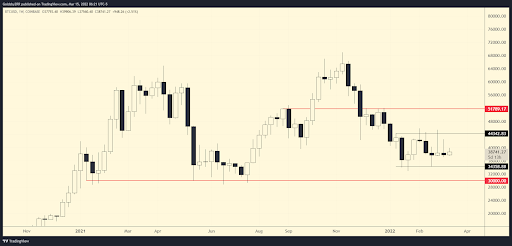
At the time of writing, Ethereum is priced at about the same price it was in last weeks’ newsletter at about $2.5k. Ethereum is also within a range with the range resistance located at about $3k and range support located at about $2.3k. For volatility to pick up on Ethereum, these areas need to be broken to the upside or downside. Should the $3k resistance break, the next target in my opinion would be about $3.6k. If range support is broken I would expect for the $1.8k – $2k area to act as support.
Ethereum breaks the $3k level and the $3.6k area is the next target where I would reduce long exposure.
Ethereum loses the $2.3k area and I would expect for an area near $1.8k to hold as support.