


Last week, MicroStrategy announced during its second-quarter earnings call that Michael Saylor would step down as CEO and take the new role of executive chairman. The CEO role was filled by the company’s president, Phong Le, and the changes took effect on Monday August 8th. According to Saylor, the role split will allow him to focus even more on the firm’s Bitcoin holdings, as he stated, “As Executive Chairman I will be able to focus more on our Bitcoin acquisition strategy and related bitcoin advocacy initiatives while Phong will be empowered as CEO to manage overall corporate operations.” Under Saylor’s leadership, Microstrategy spent about $3 Billion since 2020 to acquire 129,699 BTC at an average price of about $30,644 a coin, which means the cloud software company is underwater on its investments. Amid this year’s market downturn, Saylor said MicroStrategy would “continue to HODL through adversity,” adding that the firm had prepared for volatility and structured its balance sheet accordingly.
https://www.tradingview.com/x/AhOeO24B/
https://www.tradingview.com/x/Q3G1Yzc2/
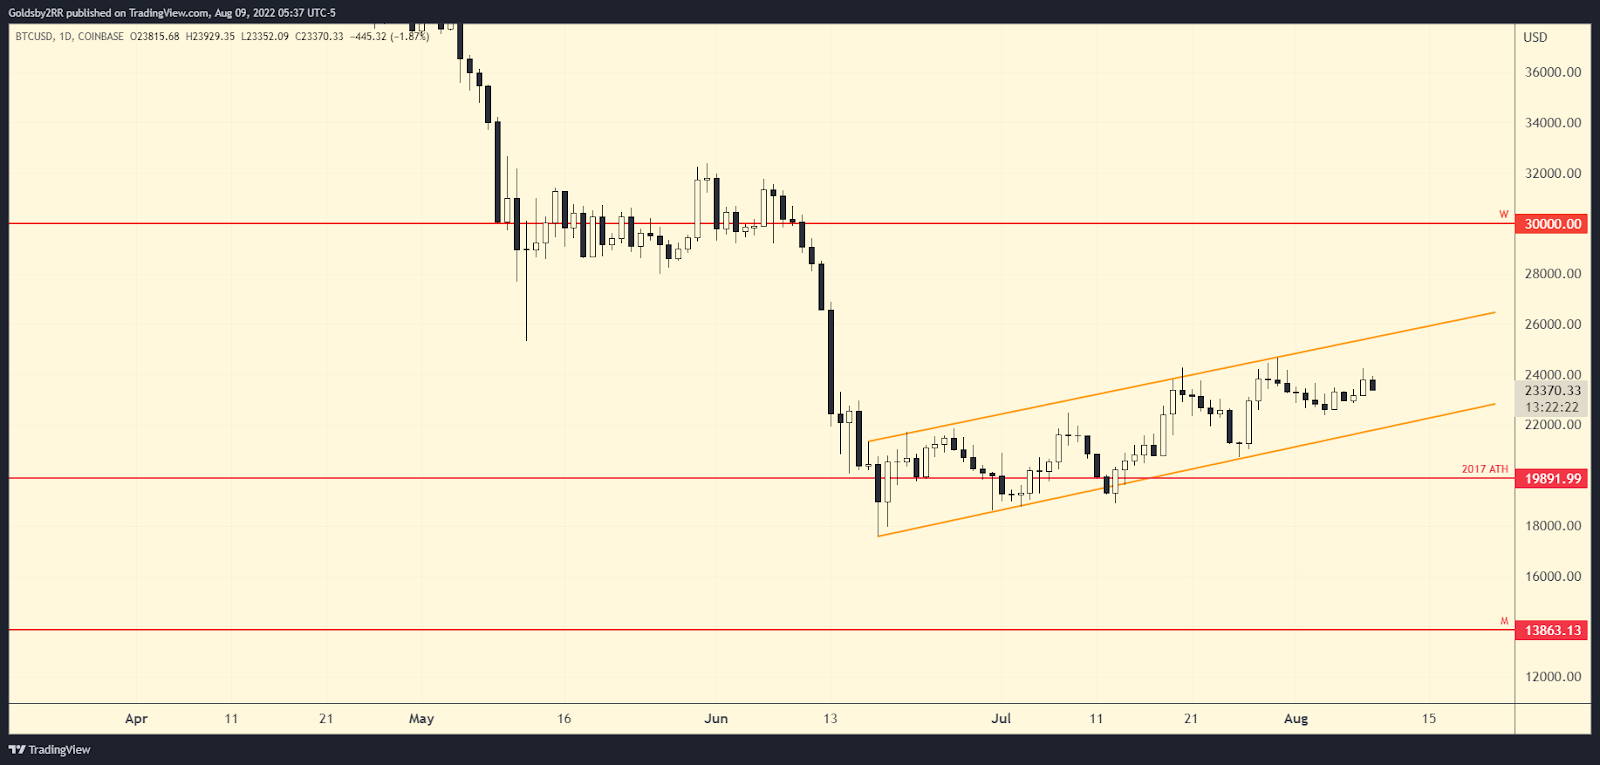
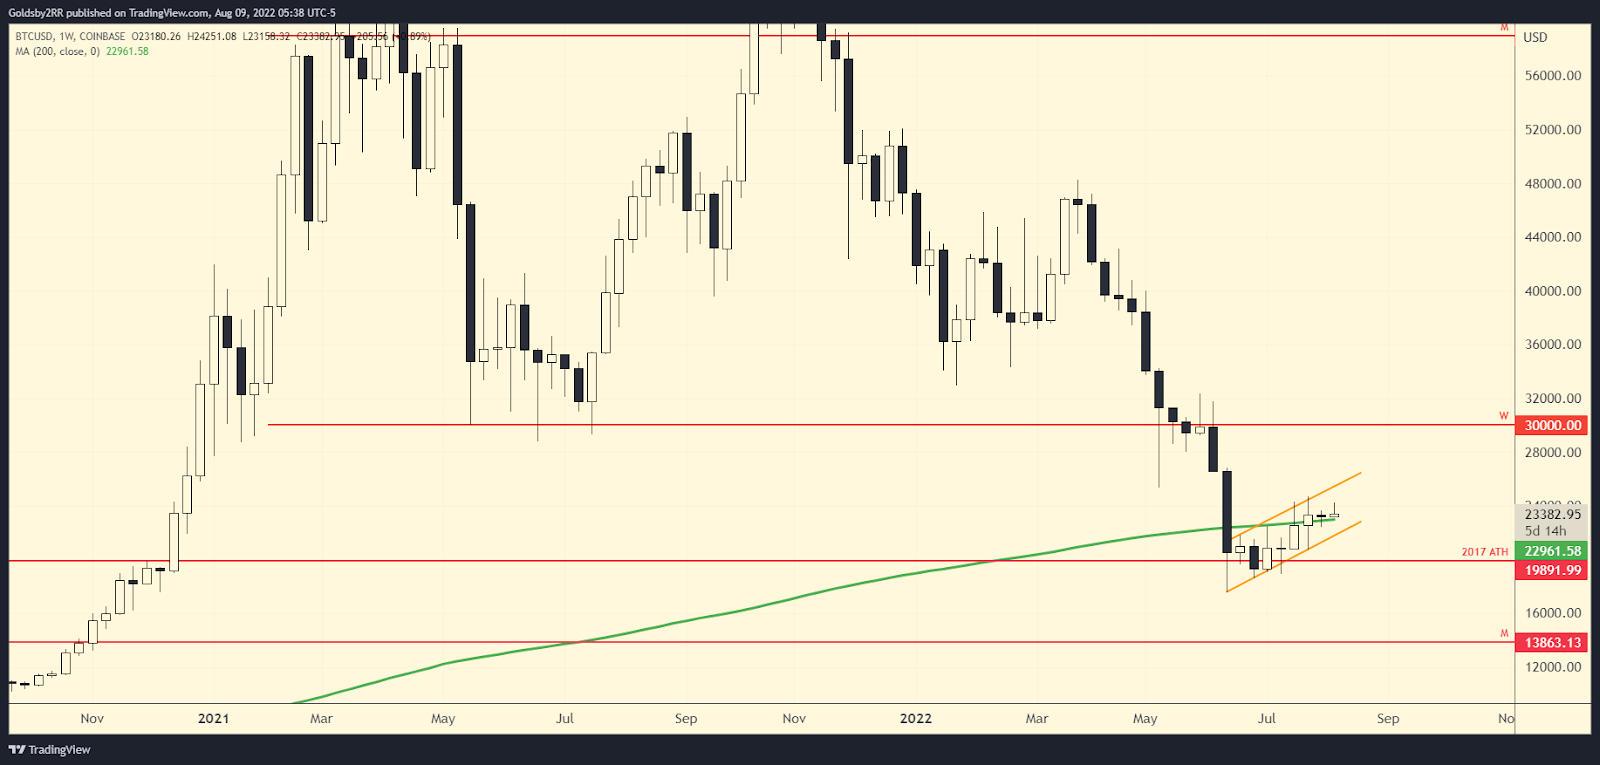
At the time of writing, Bitcoin is priced at about $23.3k and is currently trading within an upwards parallel channel (highlighted in orange). Until these boundaries are broken, I believe the best method of trading this price action is to expect bounces from support and pullbacks from resistance. When zooming out to the weekly time frame, we see that price has closed over the weekly 200MA, retested the level, and so far has continued its upward path although the move has been very slow.
As long as the price stays above the 200MA on the weekly time frame I believe the price will rise.
Bitcoin maintains the 200MA weekly level and I believe upwards continuation is in the cards.
Bitcoin loses the 200MA weekly level and/or the parallel channel levels and I believe it will go lower.
https://www.tradingview.com/x/QvRfcvS1/
https://www.tradingview.com/x/yCpDMQfk/
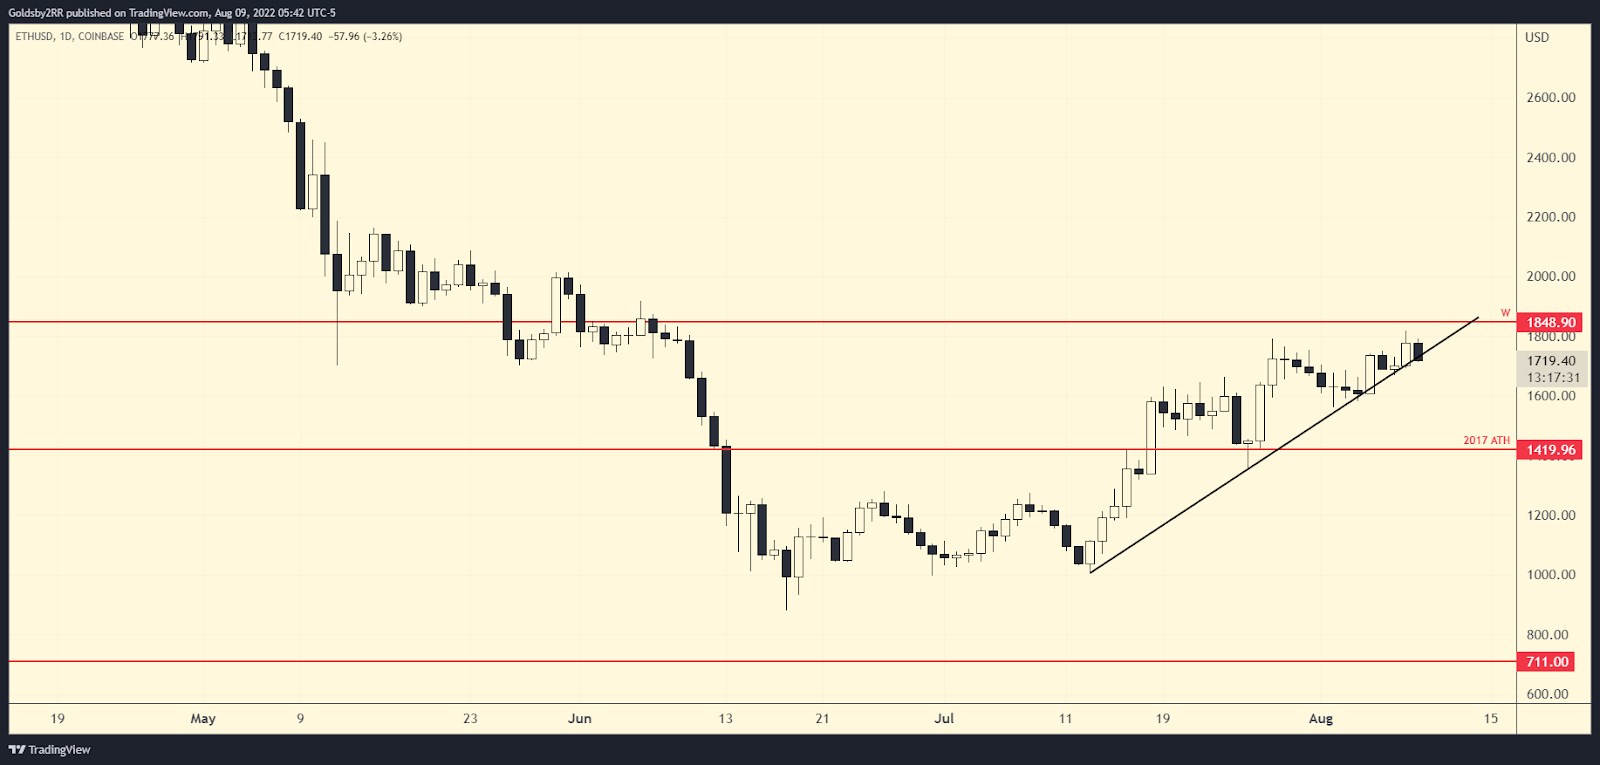
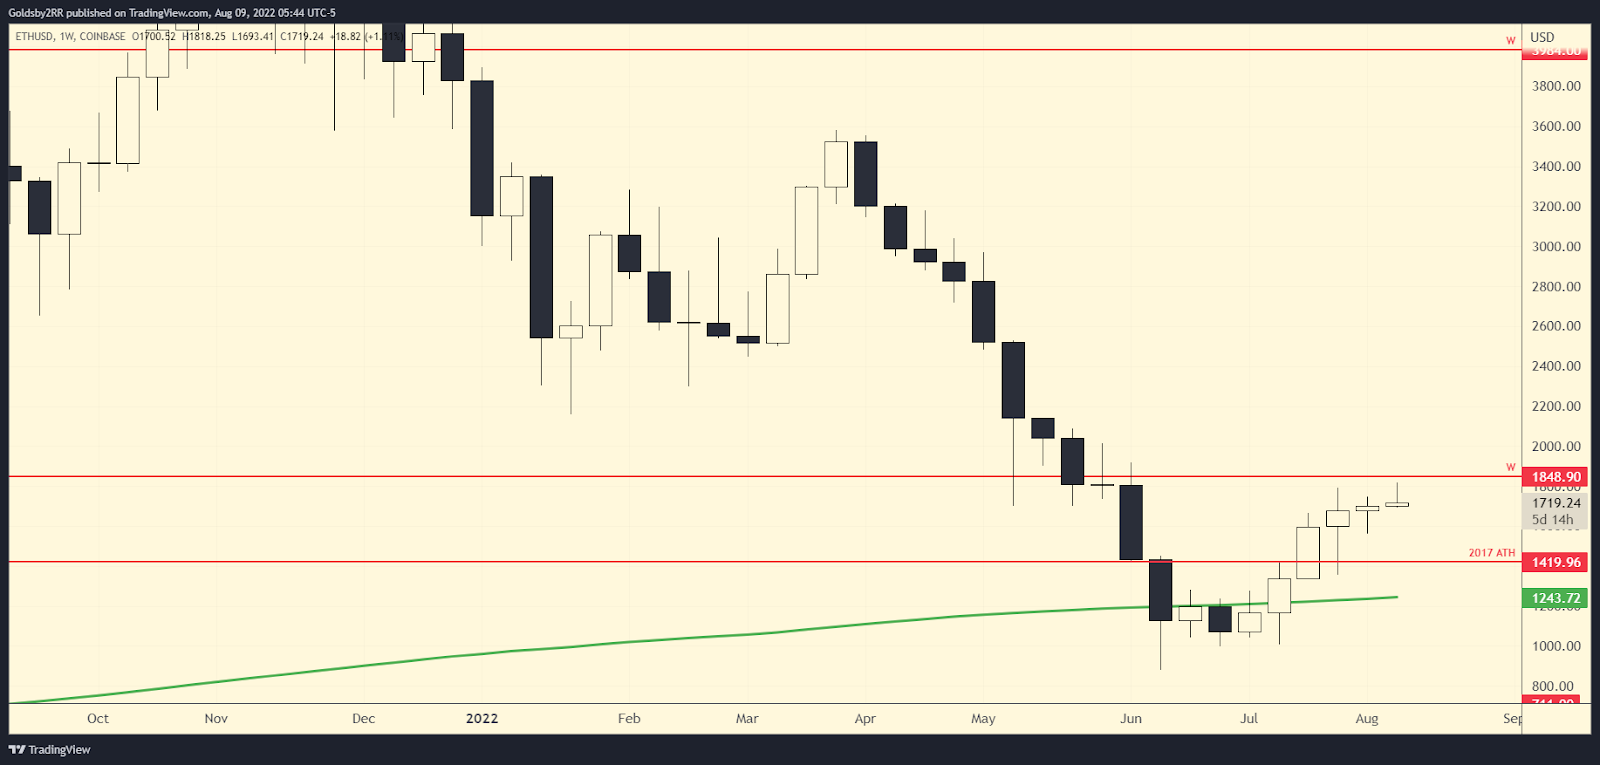
At the time of writing, Ethereum is priced at $1718, and is near its $1.8k resistance level while also trading on an upward trendline on the daily timeframe. If ETH can remain strong, I expect the $1.8k weekly resistance level to be broken, but I personally would like to see a weekly close over this level. If price is rejected away from this level or Bitcoin goes lower and drags ETH down with it, I believe a move down to the 2017 ATH level or the weekly 200MA is the most likely area of interest for support.
Ethereum closes over the $1.8k level on a weekly closing basis and I believe bulls are still in control.
If Ethereum rejects away from the $1.8k level a move back to its previous ATH or weekly 200MA is the most likely outcome.