


https://www.tradingview.com/x/VuAyQY14/
https://www.tradingview.com/x/JYUs7SvV/
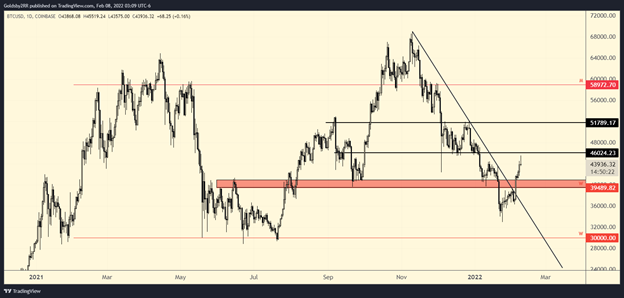
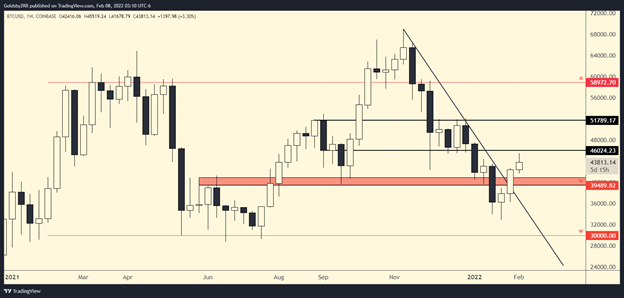
At the time of writing, Bitcoin is approximately $44k and has broken the dreaded trendline that all traders seemed to be watching. Since the last all time high was made on November 10th, every time price came into contact with this trendline, it was rejected and managed to make lower lows up until this week. Bitcoin has rallied into the $45k area that I mentioned in last week’s article, and since then, has slowed down some due to what I believe is traders taking some profit off the table at resistance. If Bitcoin can hold above the $41k level, I believe that we will have another attempt at the $45k resistance.
Bitcoin maintains its current support level at $38k-$41k and/or $BTC price rallies from here and breaks the $45k resistance.
If Bitcoin loses support at $38k, the expected area of support would either be around the $35k or $30k level.
https://www.tradingview.com/x/yCu3Huby/
https://www.tradingview.com/x/x4Uawr9F/
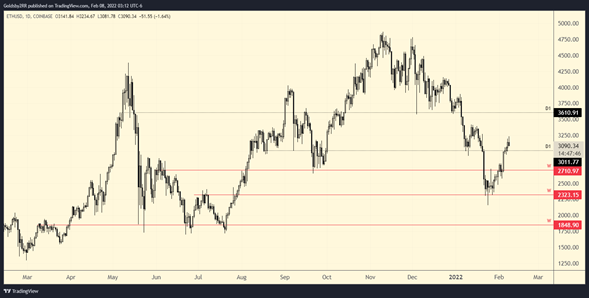
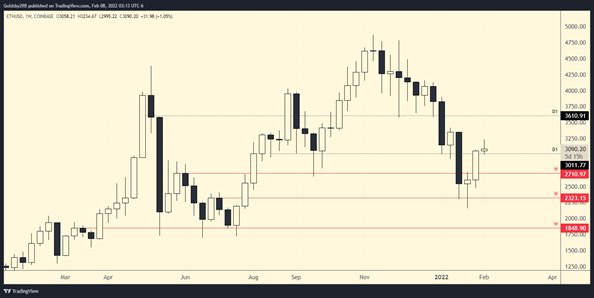
At the time of writing, Ethereum is priced at about $3.1k. I mentioned last week that the $2.7k level needed to be reclaimed and that if it did get reclaimed, I expected price to slow down at the $3k area and that is indeed what happened. For Ethereum to continue this uptrend it will have to maintain the current $3k support and I believe this would take us to $3.6k Ethereum.
Ethereum maintains the $2.7k support level and then we aim for the $3.6k resistance level.
If the $3k support cannot be held, my first area of interest would be around the $2.7k support.
On-Chain analysis is a research strategy that utilizes transaction activity recorded on the blockchain network to help traders and investors predict future price movements. Bitcoin is built on a decentralized public ledger (blockchain), which no one can control, and is open to anyone with an internet connection to view every single transaction on the network. On-Chain metrics provide data that gives investors raw transaction details such as how much Bitcoin might be moved, when it was moved, and the origin of funds.
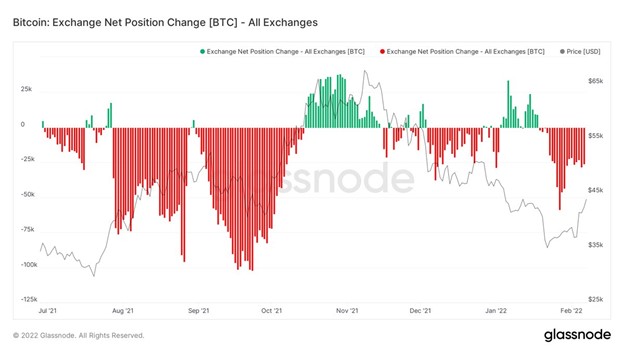
Above is a metric known as “Bitcoin – Exchange Net Position Change” which explains the current price action by using on-chain analysis. This metric shows the 30-day change of the supply held in exchange wallets. According to this metric exchange outflows have been outpacing inflows. Outflows are typically bullish, and this could imply that there is increasing buying pressure from investors.