


https://www.tradingview.com/x/Aou9SjQH/
https://www.tradingview.com/x/DCZn7oKX/
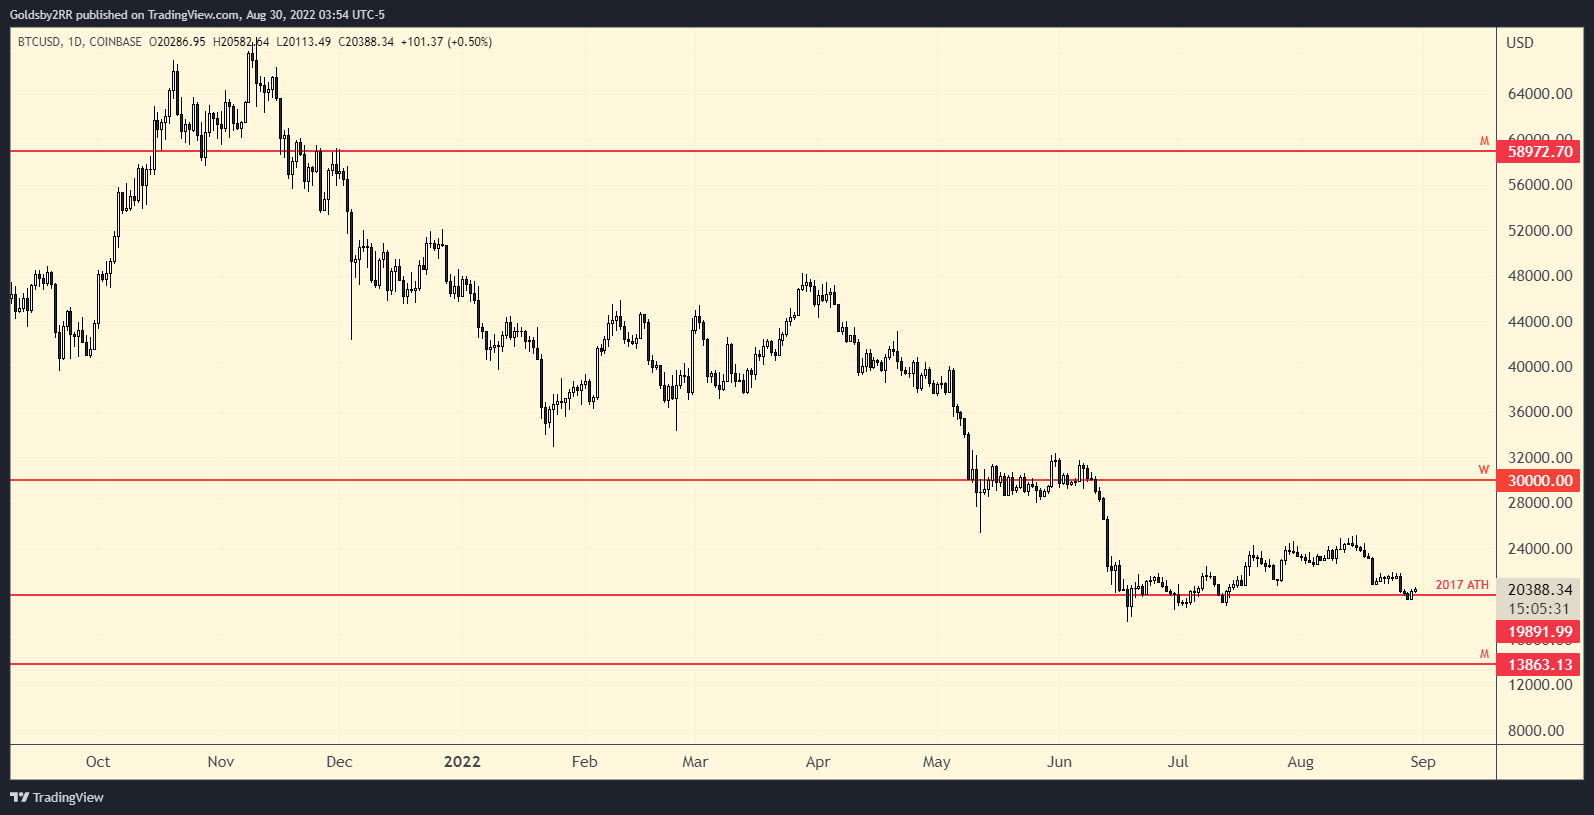
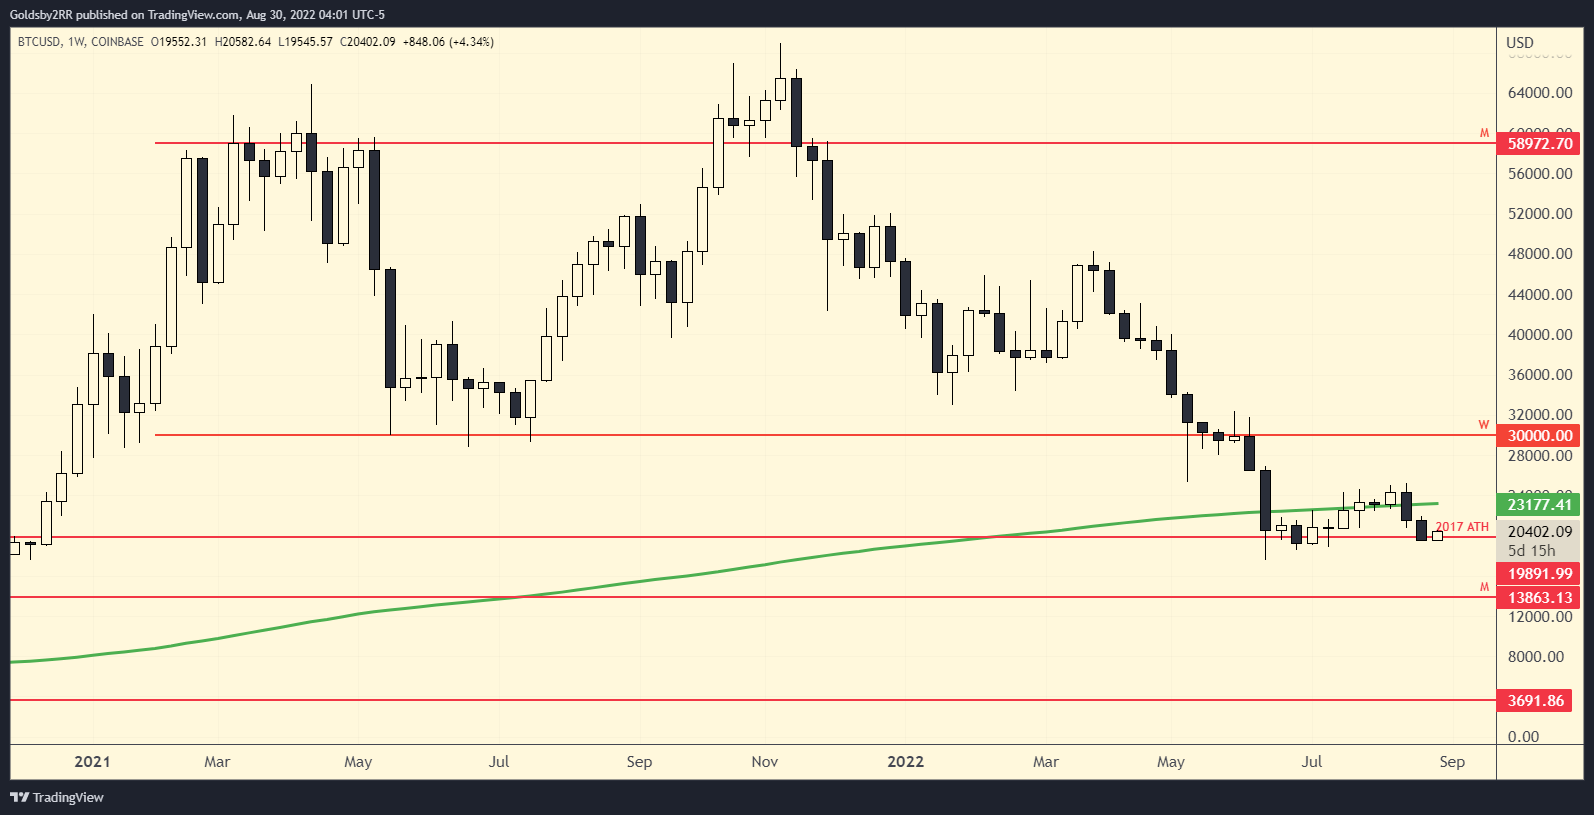
At the time of writing, bitcoin is trading near $20.4k and is trading right above its prior 2017 ATH. As we explained in last week’s article, $20k was expected to provide some short term support due to it being the last cycle’s all time high as well it being a nice psychological round number. While there is no guarantee that this number will hold, traders/investors could bid this area with invalidations down to the lows made in June of this year. I believe any price action below that area would bring in new lows for bitcoin.
Bitcoin maintains the $20k cycle high level and attempts to reclaim the 200 weekly MA on a weekly closing basis.
Bitcoin loses the 2017 ATH level and/or the lows made in June and I believe lower prices are to come.
https://www.tradingview.com/x/1EsWhUjl/
https://www.tradingview.com/x/yKnkO4YW/
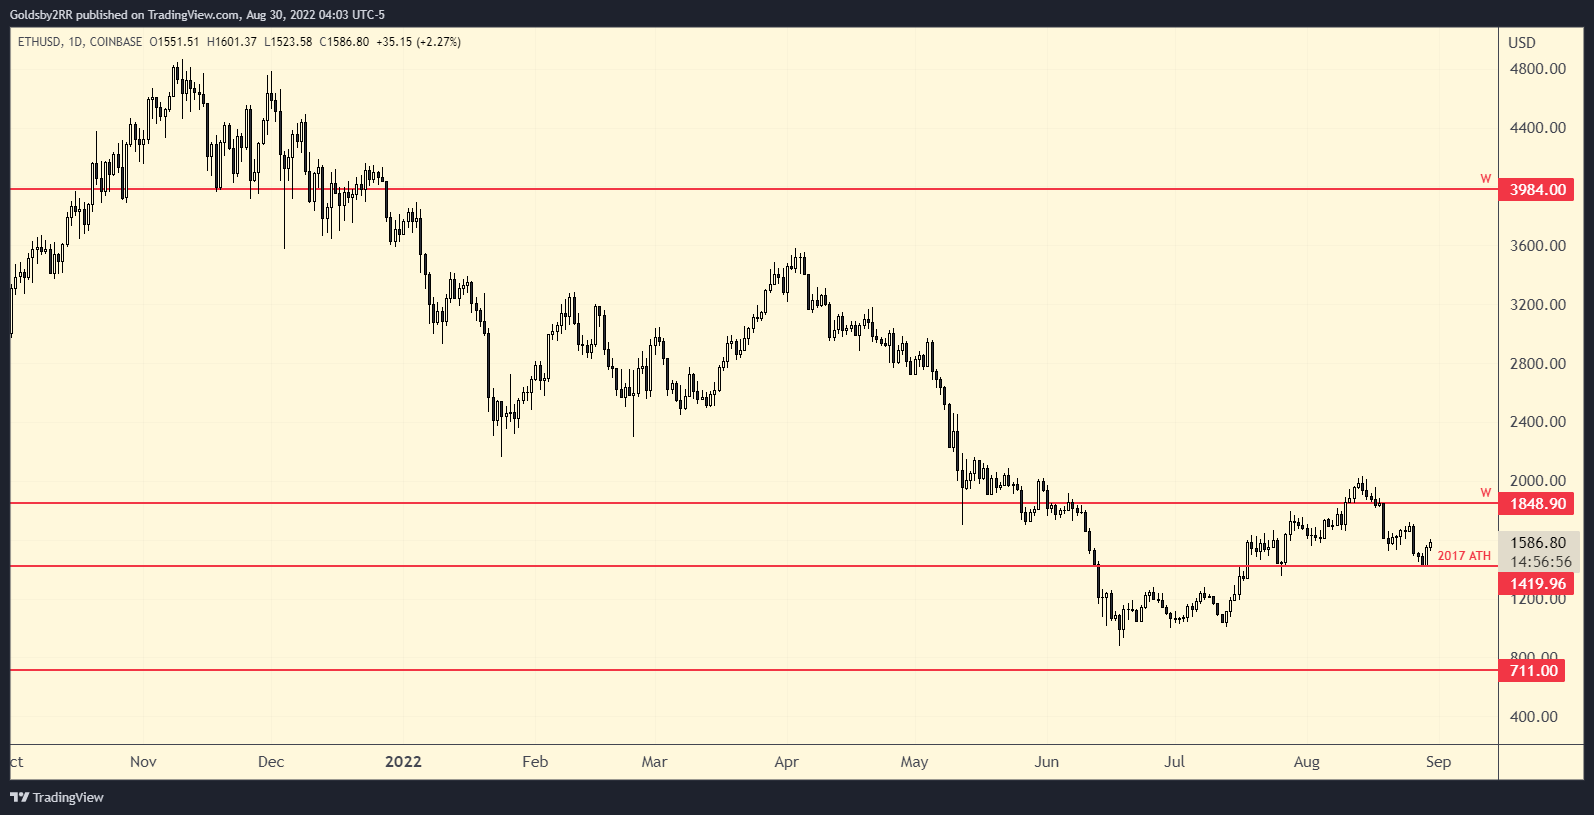
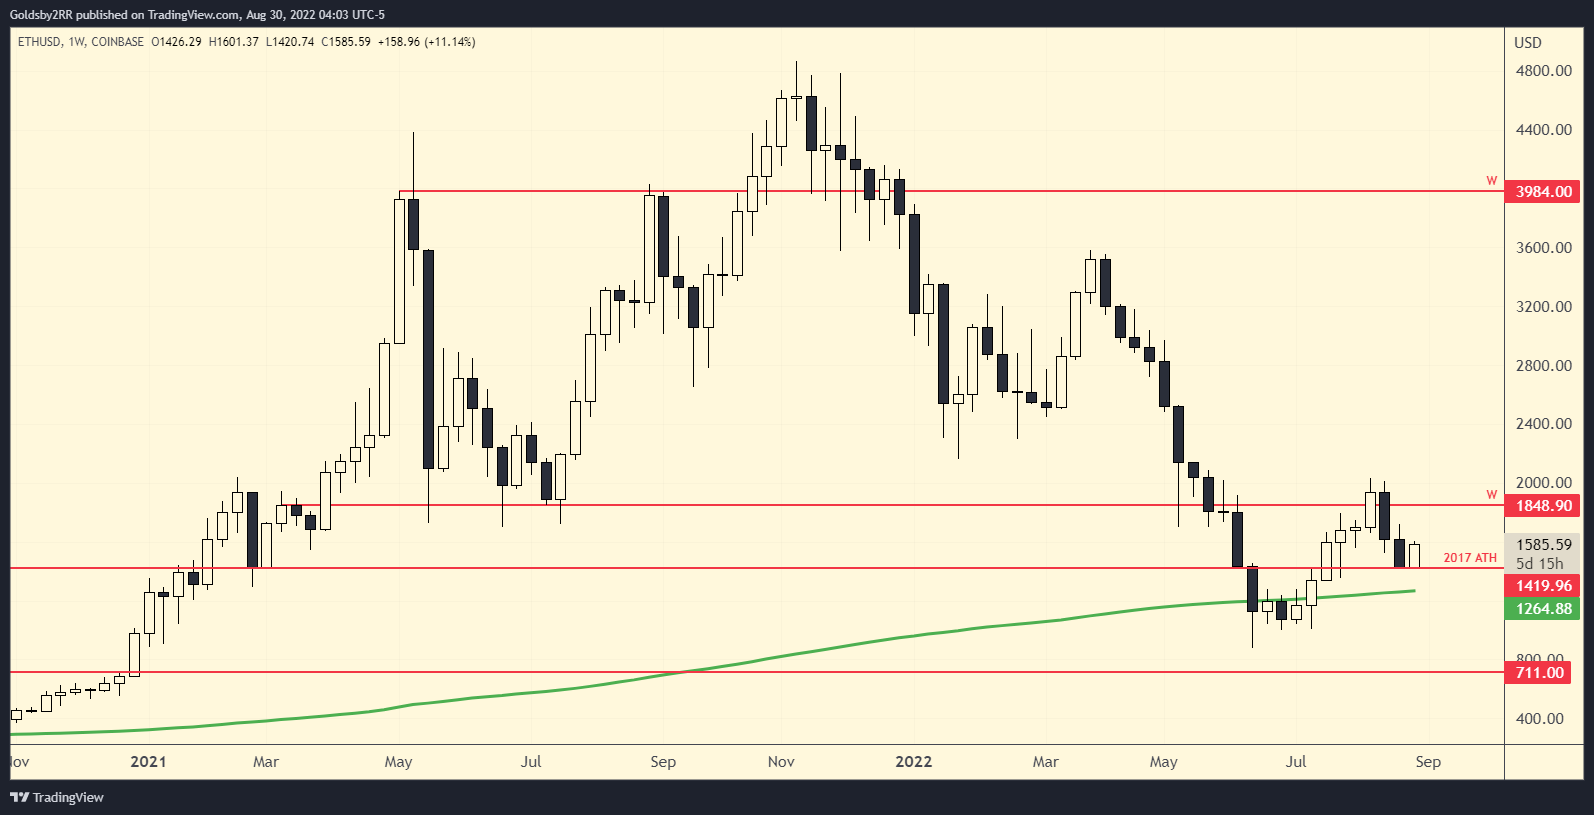
At the time of writing, Ethereum is trading around $1600, and is currently giving a reaction off the prior 2017 cycle high level located at $1400. Unlike bitcoin, ethereum is still above its weekly 200MA and has not yet retested this level. If the 2017 ATH level does not hold, I expect a reaction from the weekly 200MA level right below, although I am not sure how long this area would act as support. If bidding the 200 weekly MA, I believe the best way to trade the level is to wait to see how this weekly candle closes.
Ethereum maintains the 2017 cycle high level and pushes back up to the $1.8k level for a chance at a reclaim of the level.
Ethereum loses the 2017 ATH level and/or the weekly 200MA and we look at the lower weekly and monthly candle structures as support.
https://www.tradingview.com/x/XFXbgN9R/
https://www.tradingview.com/x/4sehp7Zb/
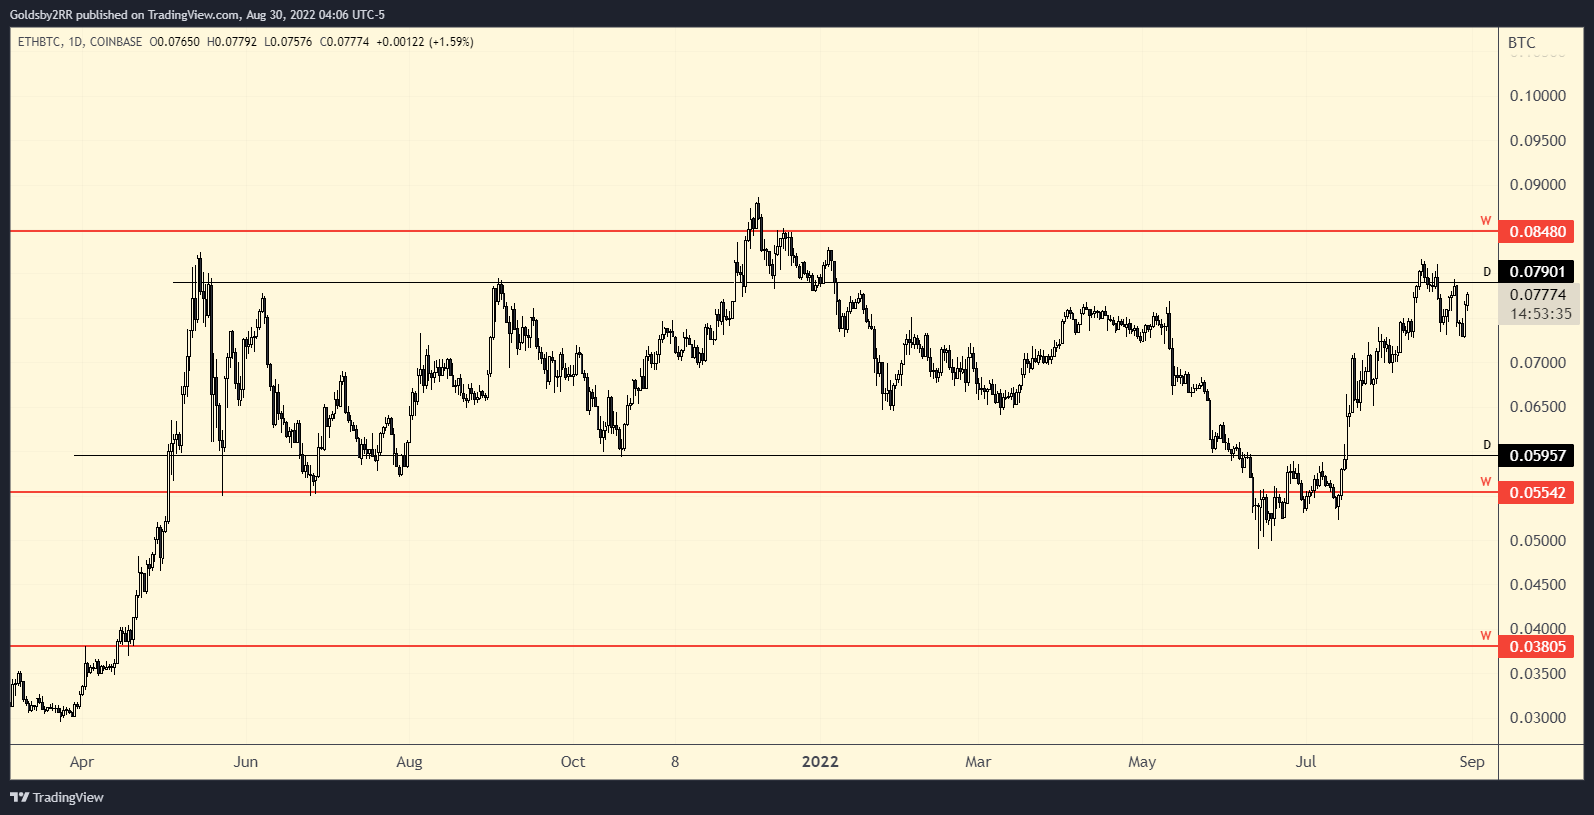
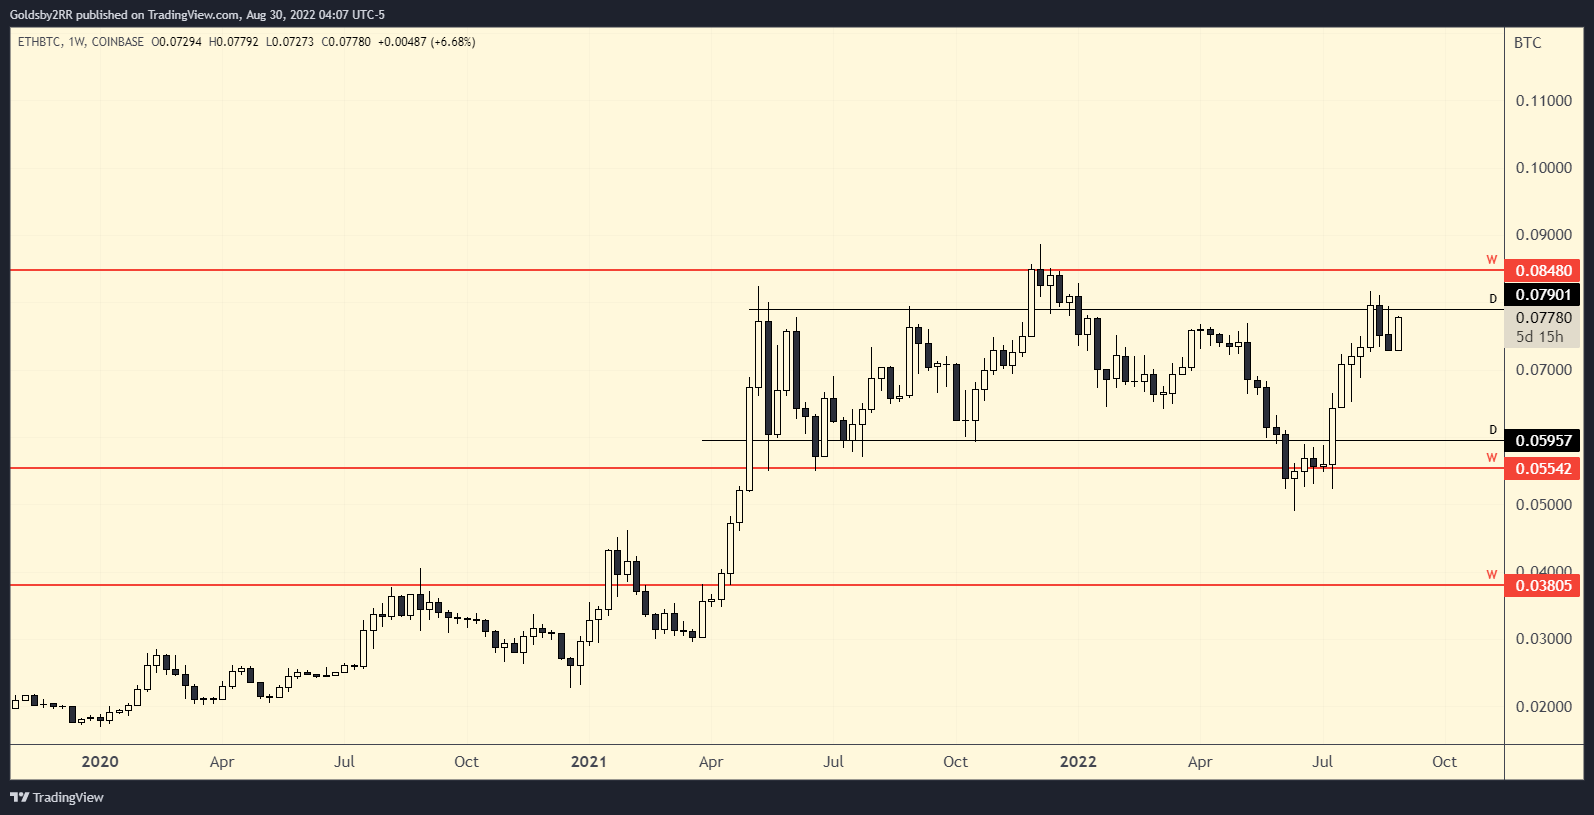
At the time of writing, ETH/BTC is valued at 0.077 and is trading back near its resistance level. With the upcoming ethereum merge event coming up next month, it is possible that the range could be broken to the upside although it is still worth noting that price is at resistance, and should be treated as such until the resistance level is broken/flipped into support. If the 0.08BTC level can be broken there is another area of resistance located around 0.085BTC that could also potentially slow ethereum’s momentum down.
Ethereum reclaims the weekly support level located at 0.085BTC and I believe altcoins will see relief bounces.
ETH/BTC rejects from the two levels listed above and a move back down to the range support in the coming months is very likely.