


Terra’s (LUNA) algorithmic stablecoin (UST) has flipped Binance’s stablecoin (BUSD) to become the third largest stablecoin by market capitalization. UST’s total market cap has risen over 15% in the past 30 days and is approximately valued at $17.5 Billion, while BUSD is valued slightly lower around $17.46 Billion. Since November, UST’s market cap has increased over 500%, and the only stablecoins that have a higher market cap are Tether (USDT) at $82 billion, and USD Coin (USDC) at $50 billion. Although UST is leading by market cap, BUSD still has a larger trading volume with $3 billion worth of trading volume over the last 24 hours compared to UST’S 24 hr trading volume of $430 million. Previously, UST was the 4th largest stablecoin and the 14th largest cryptocurrency, but has been making headlines with the help of Terra Founder Do Kwon, who claims the project will amass $10 billion in BTC to back its UST reserves.
https://www.tradingview.com/x/Q16mstgs/
https://www.tradingview.com/x/1SH7dQNA/
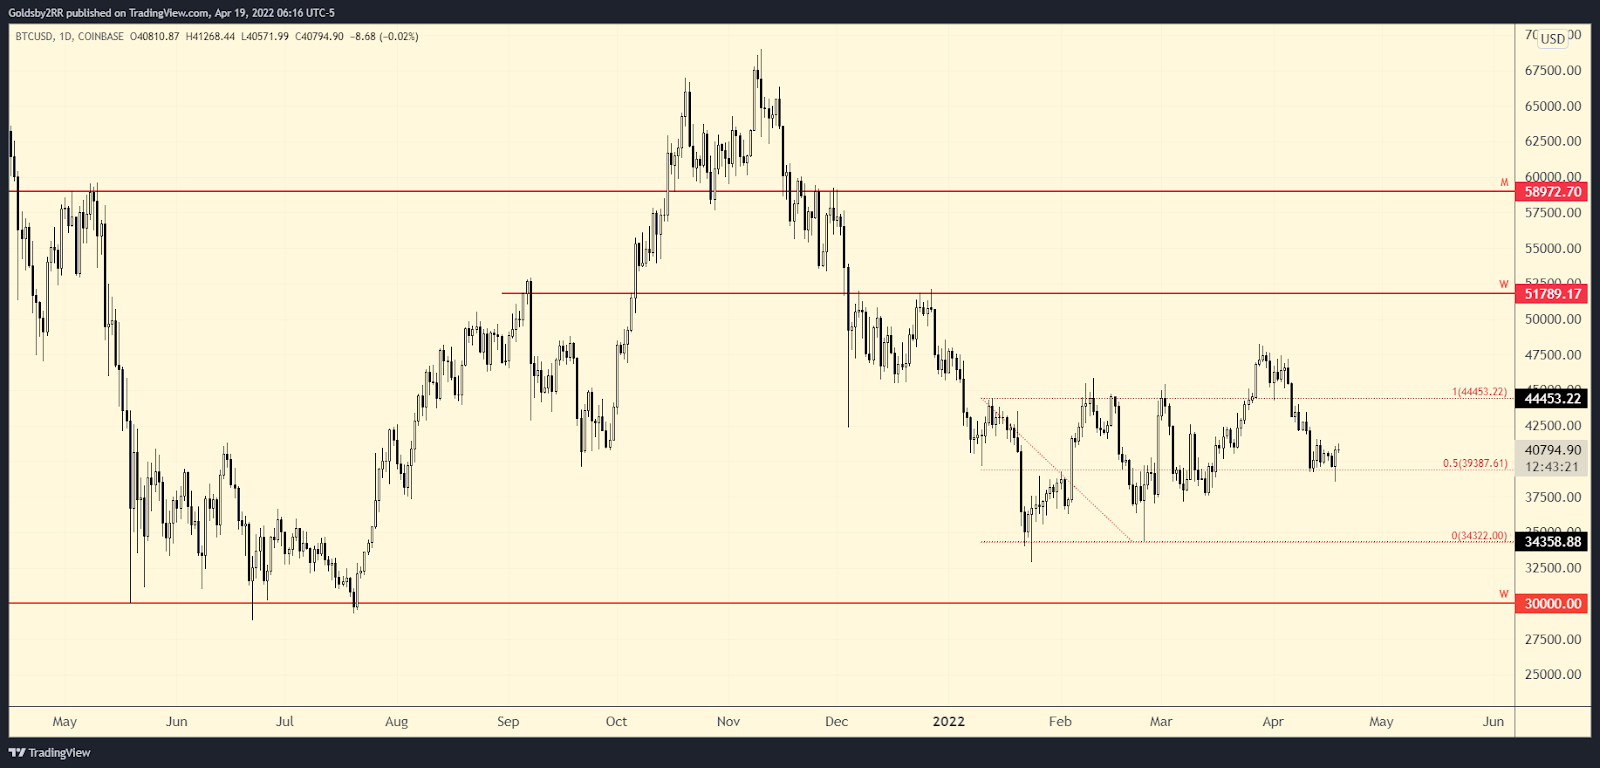
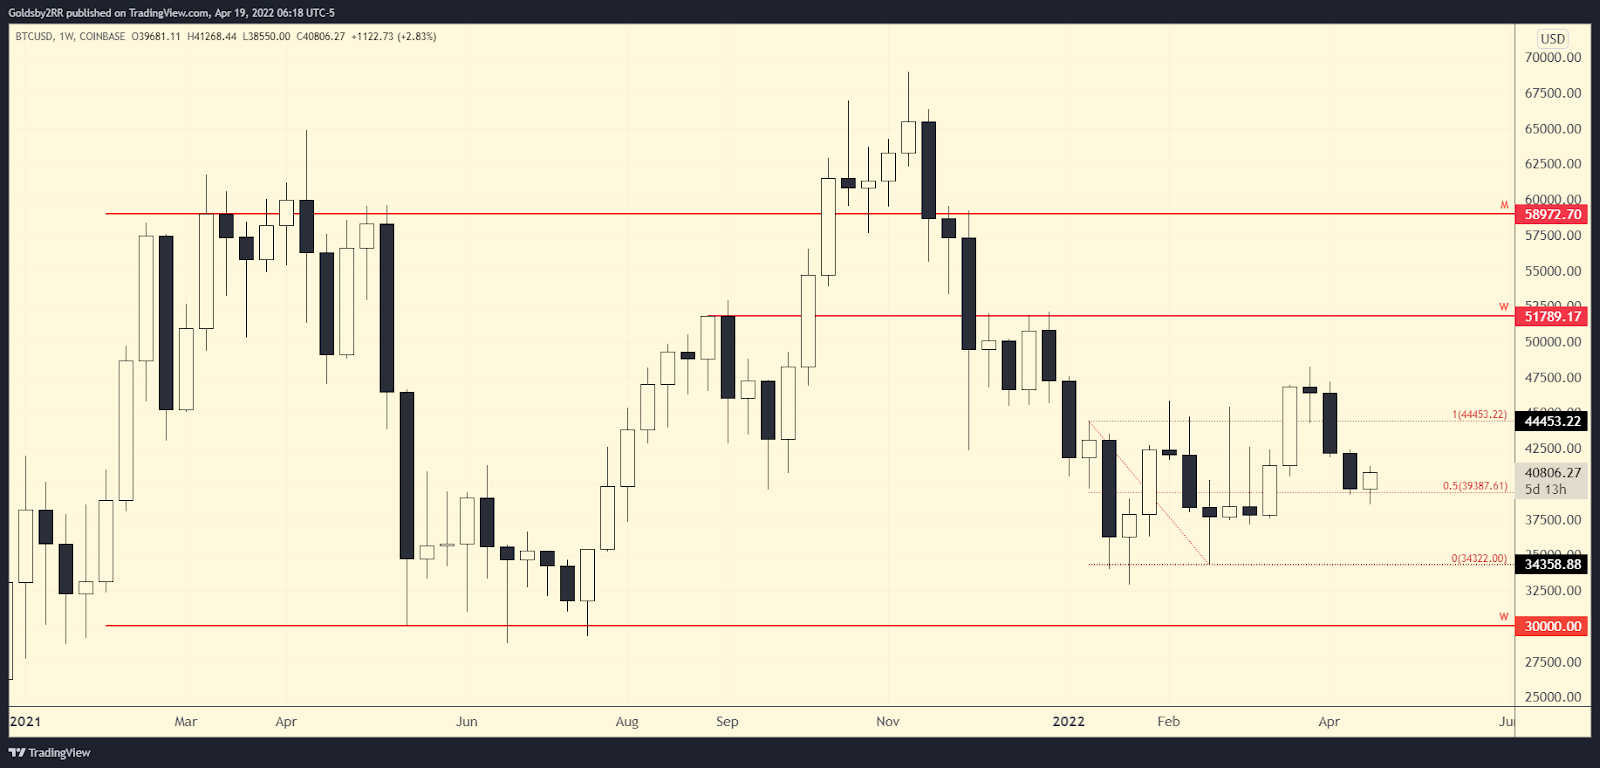
At the time of writing, Bitcoin is priced at about $40k and still has not reclaimed the $44k level that it lost. While price has not yet nuked any further and the bear momentum has seemed to slow down for now, at best Bitcoin has been giving us nothing but choppy price action. I personally expected BTC to chop around during the Easter Holiday as the legacy markets were closed and people were spending time with their families. Another possible reason for the slow down of volatility could also be due to price hitting the midpoint of the range and pausing before the next move. If price can manage to make it back over the $44k level I believe we would get another shot at the $52k level. A daily close under the midpoint level would lead me to believe that we revisit the range low.
Bitcoin holds the current level and reclaims the $44k resistance while flipping it back into support.
Bitcoin loses the midpoint level and I believe we drop to the range low around $34k or lower at the $30k level.
https://www.tradingview.com/x/UqxX1mke/
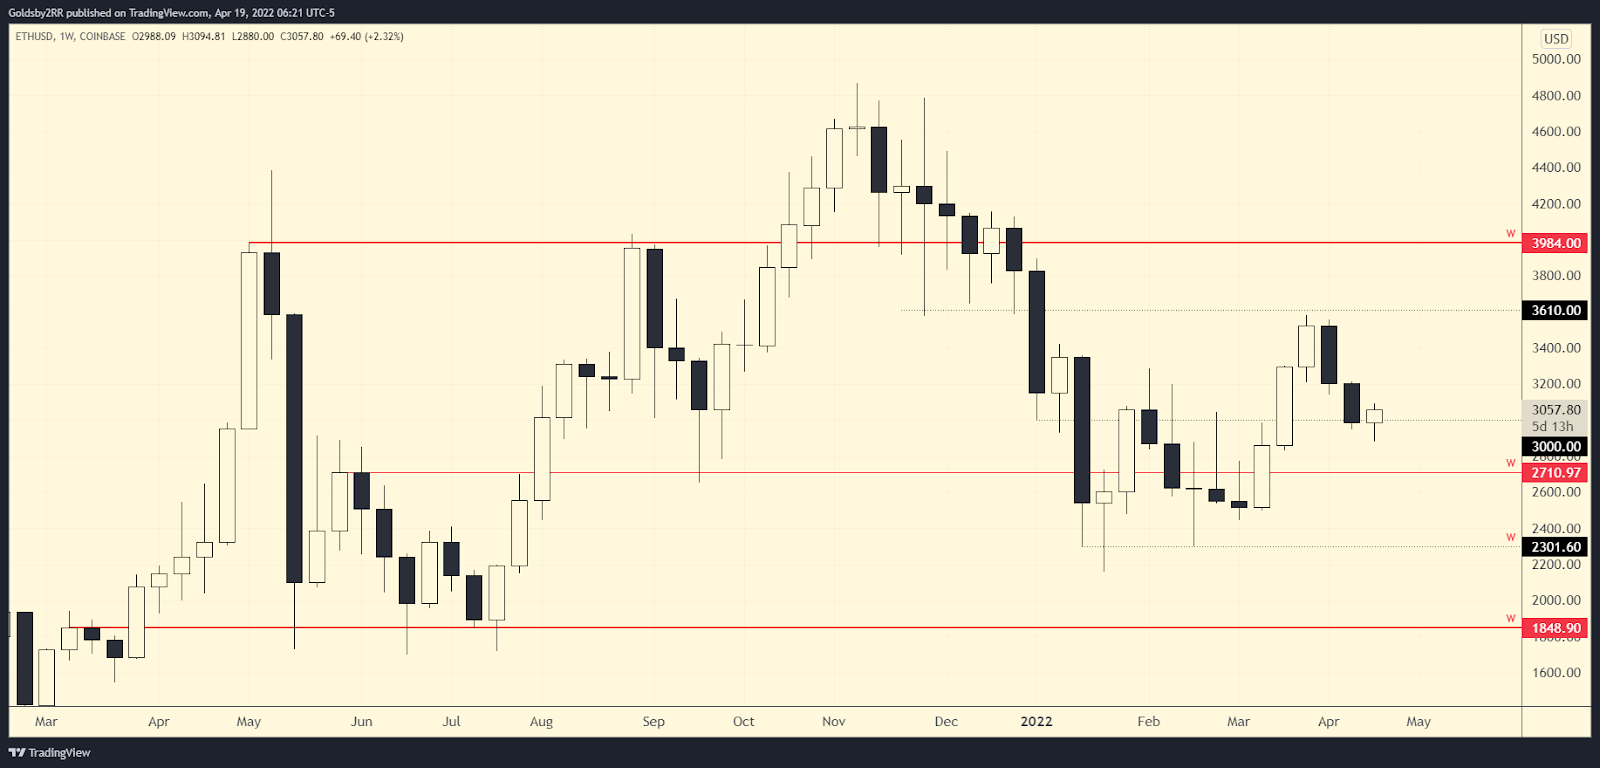
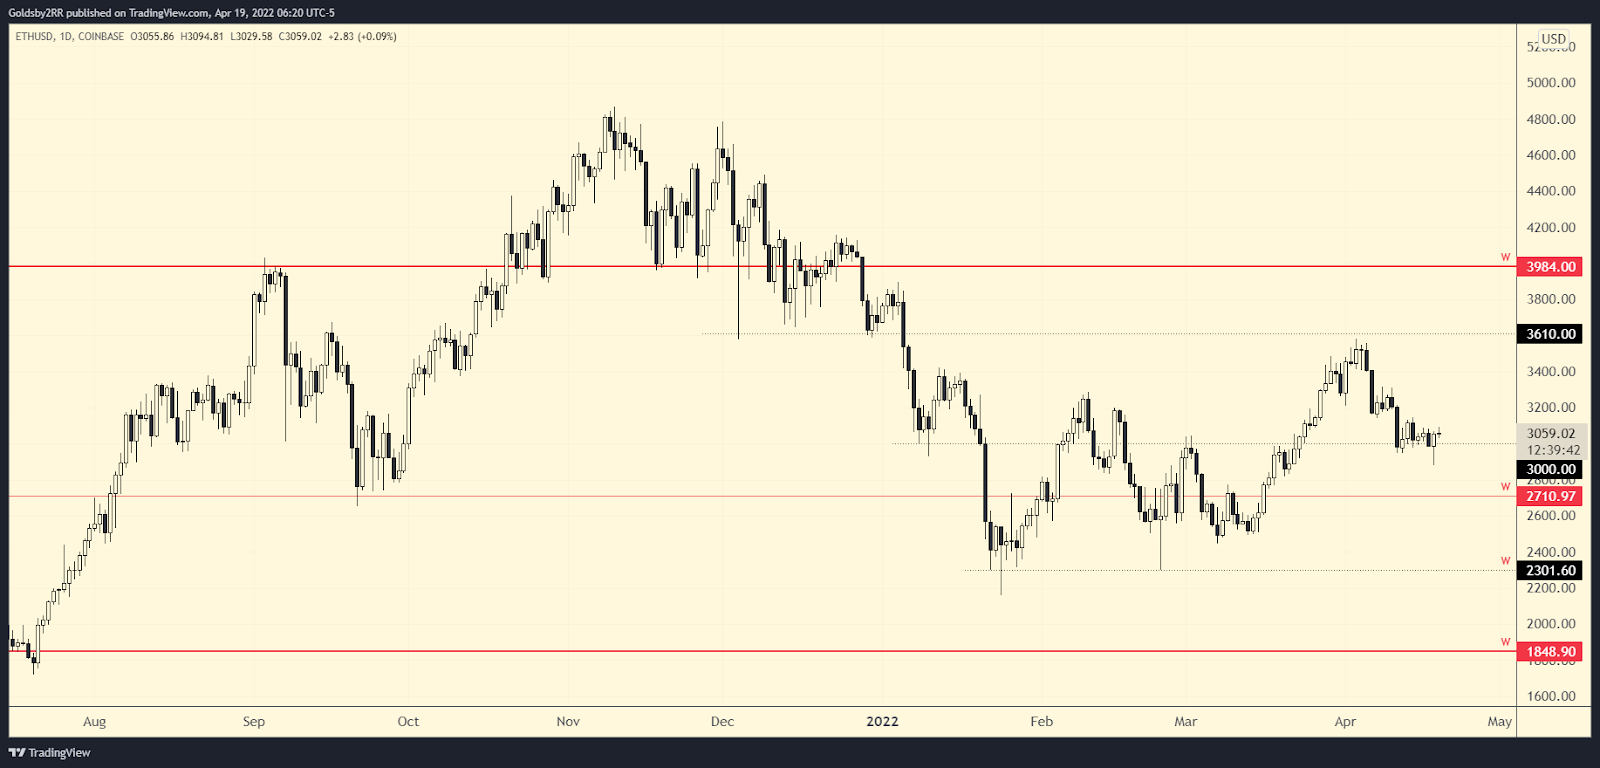
At the time of writing, Ethereum is priced at $3050 and has also given traders nothing but chop over the Easter weekend. In the last newsletter I mentioned that price at the $3k level could be a great long opportunity for anyone who was bullish, but price is still almost exactly in the same place as it was last week, and I am not sure how much longer price can grind into the $3k support level before running out of buyers and seeing sellers have the upper hand. While there seems to be little to no volatility at the moment, If bitcoin could manage to push higher then I think it could pull ETH up with it. If the $3k level cannot be held I would expect the $2.7k area or lower to act as support again.
Ethereum maintains the $3k level and pushes back up to the $3.6k level
Ethereum loses the $3k area and we look for either $2.7k or the $2.3k level to act as support.