


On early Monday morning the Neutrino Dollar (USDN), an emerging stablecoin backed by the WAVES ecosystem, lost its 1:1 value against the dollar as the WAVES token saw a double digit price decrease. USDN fell by more than 15% to $0.83 and wiped out about $200 million dollars in the process. USDN is related to the price of WAVES, because the dollar pegged coin is backed by staked WAVES tokens. The price also influences the yield that users earn on USDN in the Vires.Finance dApp.
Last week several accounts on twitter accused the WAVES team of manipulating the price of its token through the DEFI lending platform Vires.finance, but WAVES CEO Sasha Ivanov denied the accusations and further accused Alameda Research (founded by FTX CEO Sam Bankman – Fried)of manipulating the price of WAVES and organizing a FUD campaign in order to trigger panic selling. Vires.finance is losing liquidity amidst the controversy and the DEFI platform has dropped to about $945 million from $1.26 billion in just three days.
https://www.tradingview.com/x/hgYbxqJg/
https://www.tradingview.com/x/lW6vZVPG/
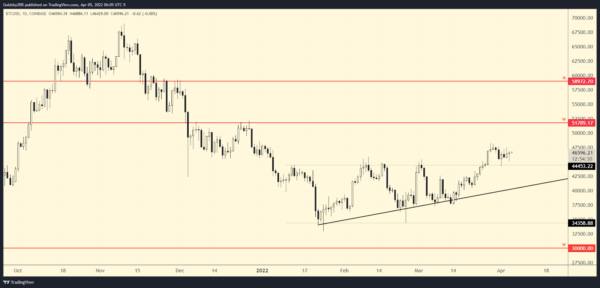
At the time of writing, Bitcoin is priced at about $46.6k. Bitcoin has broken out of the ascending triangle pattern and has even given a perfect retest of the $44k resistance turned support level. Since the breakout, the momentum seems to have slowed down and price action has been very uninspiring as everyone awaits a further push up in price. From a trader’s perspective Bitcoin is still bullish and just needs to stay above the support level to continue to be bullish. The next area of resistance is around the $47k area with support directly below at $44k
Bitcoin maintains above the ascending triangle support line and breaks above the $47k resistance
Bitcoin loses the support line and we look for $34k to act as support again
https://www.tradingview.com/x/iWCA3XDm/
https://www.tradingview.com/x/tHq9UM5G/
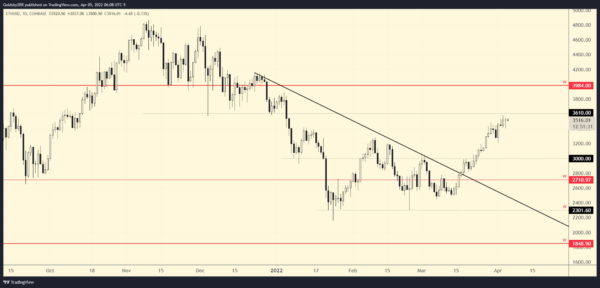
At the time of writing, Ethereum is priced at about $3.5k and has approached the $3.6k resistance level that we discussed in our previous articles. Ethereum’s breakout was a lot stronger than the breakout on Bitcoin, and it seems that the recent BTC rally may have been led by Ethereum. At this time I am not certain if it will stay this way but from my experience if you want a healthy crypto market, you want to see strength in BTC and you want BTC to lead the market. When the market is ETH lead it tends to run out of steam faster and the market usually ends up coming back down. If the Ethereum rally can continue and manage to break $3.6k, $4k should be the next stop above.
Ethereum flips the $3.6k level into support and we aim for $4k
Ethereum rejects the $3.6k area and we look at the $3k – $3.3k level to act as support