


Technical Tuesdays
https://www.tradingview.com/x/idQrGvPM/
https://www.tradingview.com/x/tpZU5xjK/
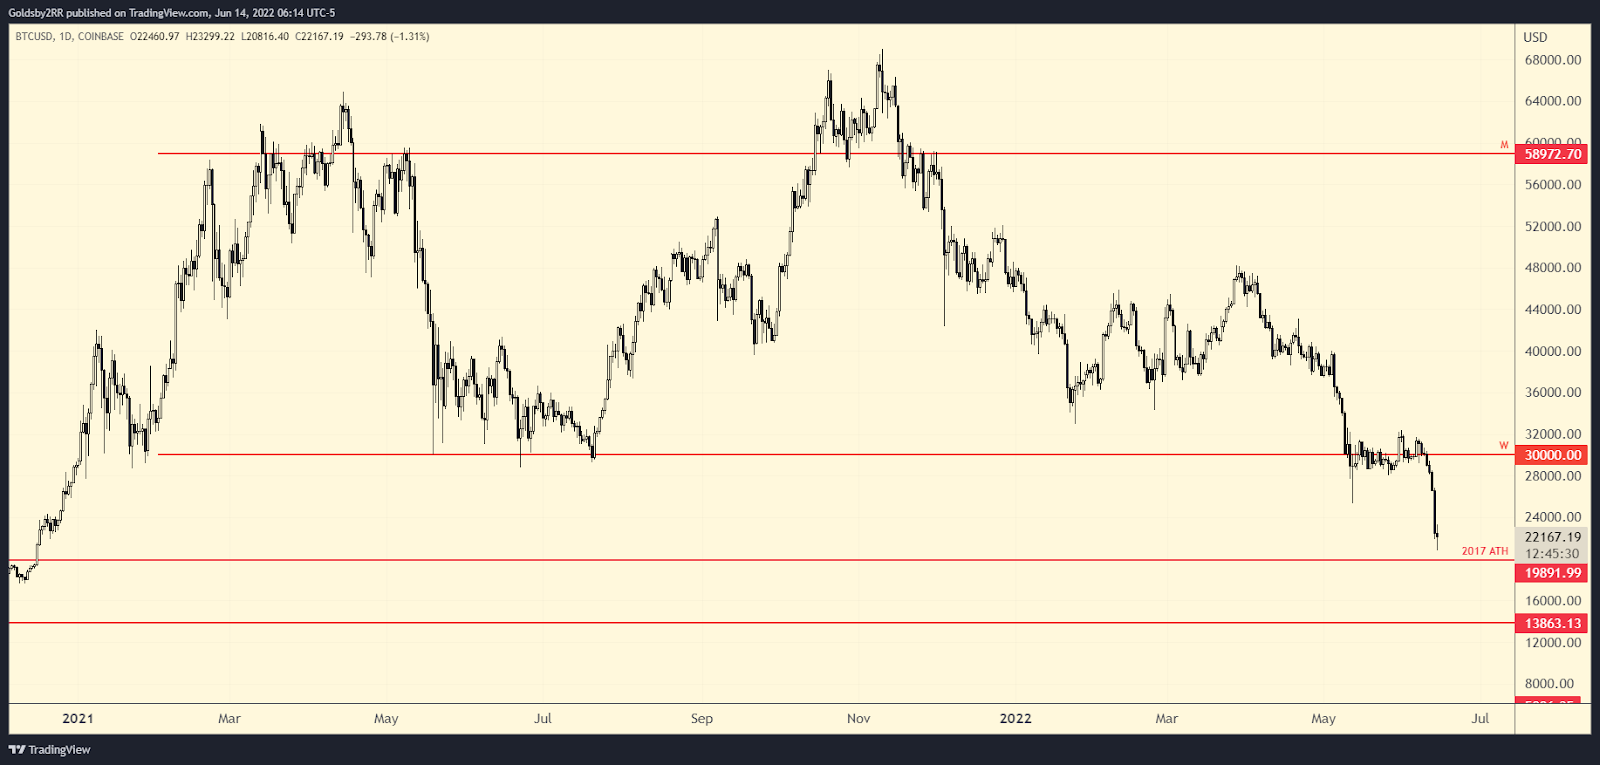
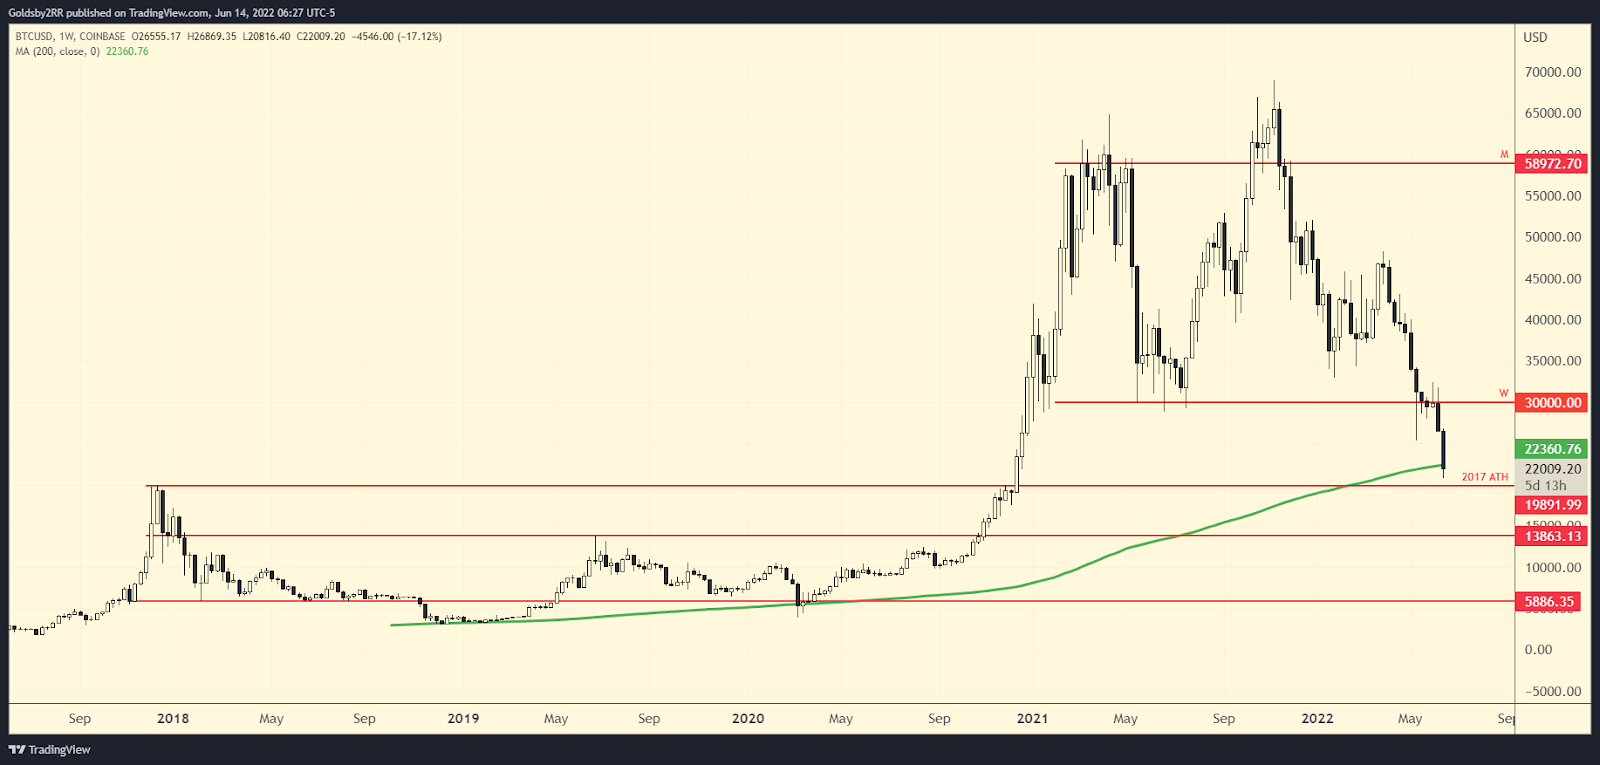
At the time of writing, Bitcoin is priced at about $22k after dropping about twenty five percent from its $30k price. Bitcoin has found some short term support near its 2017 all time high which is the same price area that coincides with its weekly 200 moving average.
If this level does not hold up as support the next area to expect to act as support would be the highest monthly candle body close from 2017 located around the $14k area.
I personally think waiting to see how price action plays out is a better strategy than blindly buying the 200 week moving average and hoping that the level holds.
Bitcoin maintains the 20k previous ATH level/200 weekly moving average on a weekly closing basis and that would prove to me that the level is showing strength.
Bitcoin does not maintain the $20k level and ultimately pushes down to the next support level around $14k.
https://www.tradingview.com/x/91OQlJAn/
https://www.tradingview.com/x/xPbCCOgR/
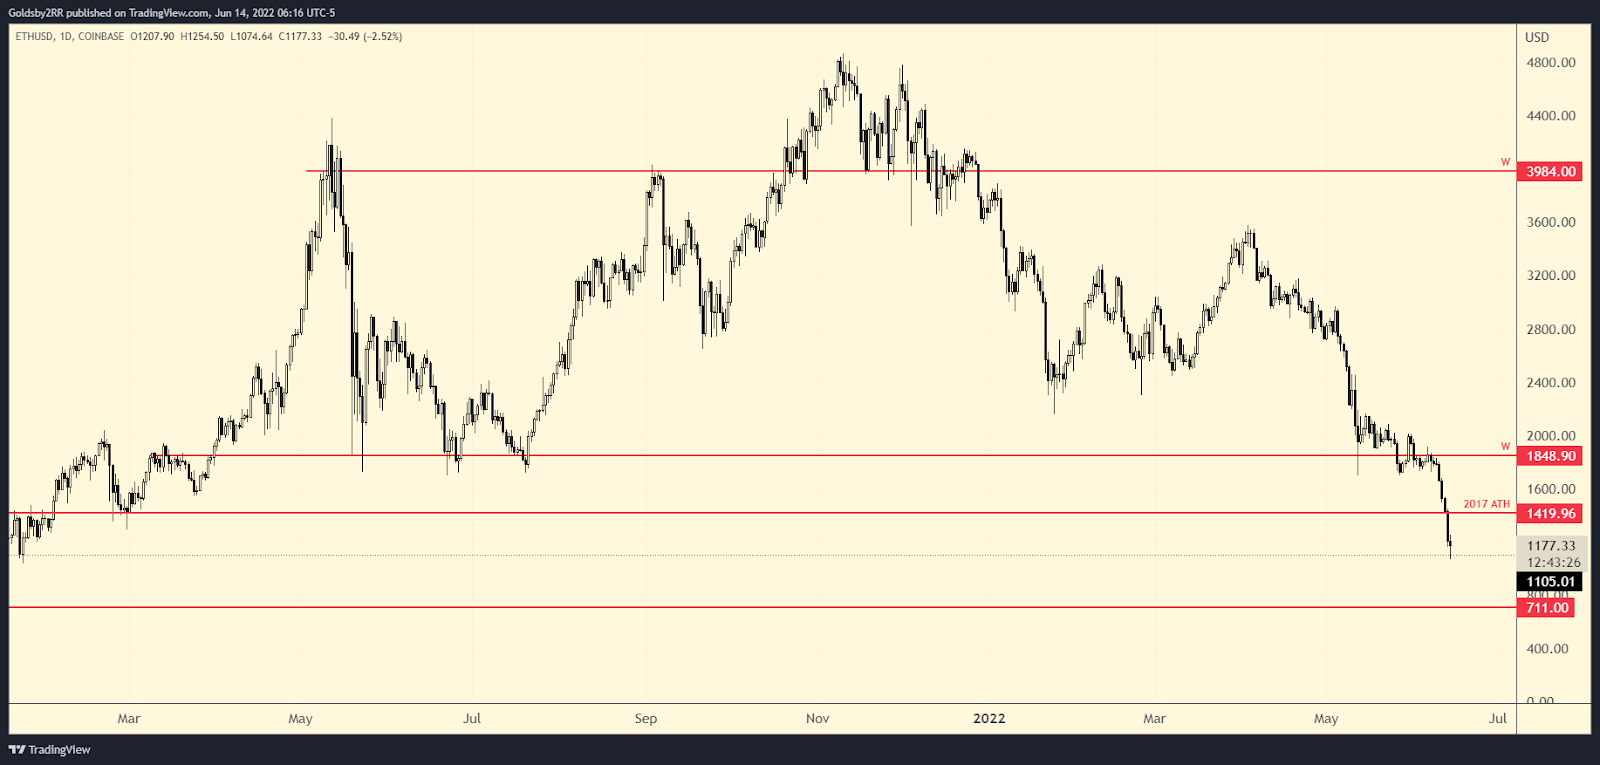
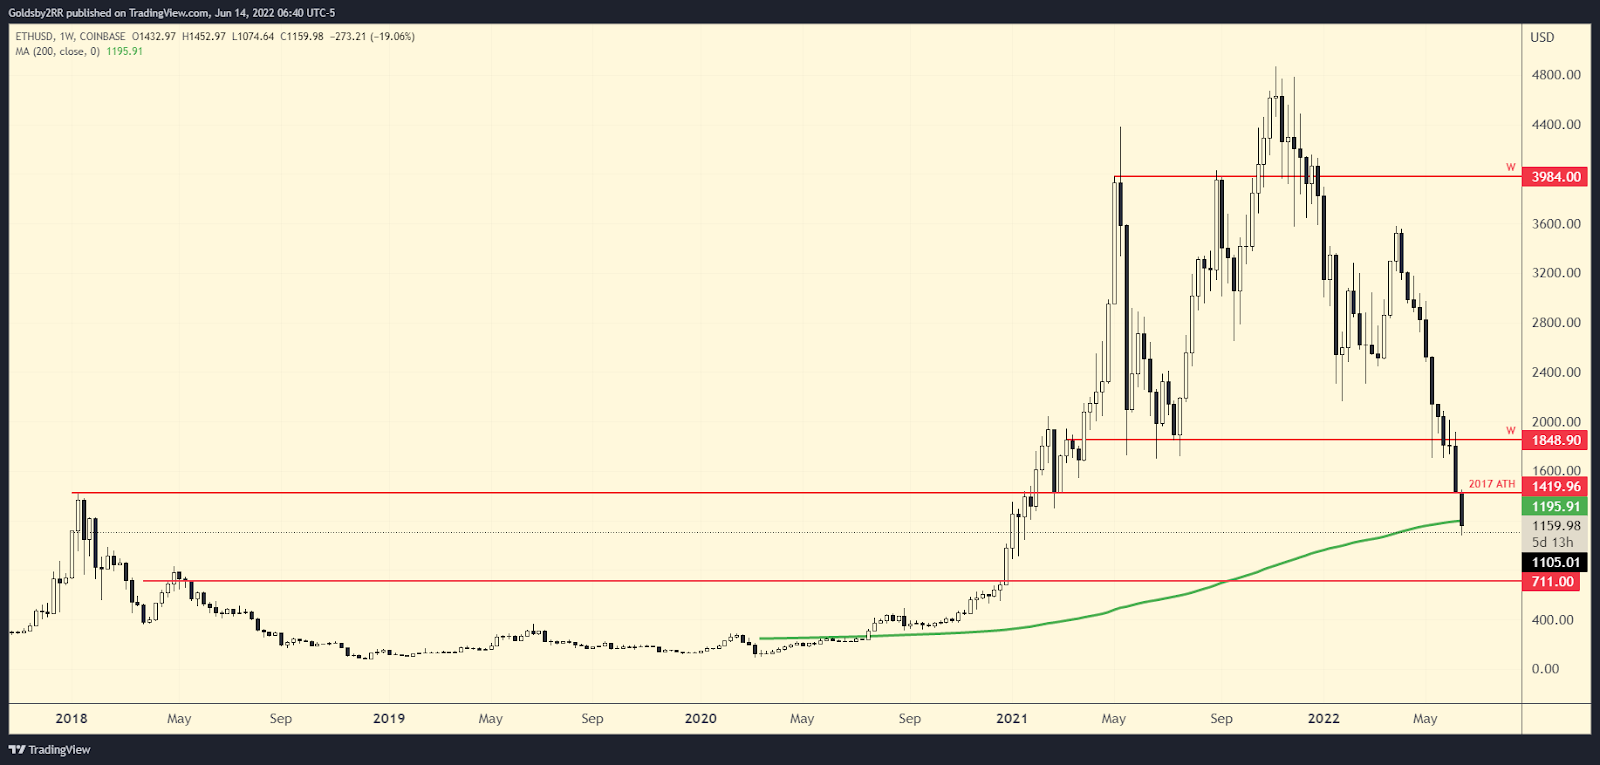
At the time of writing, Ethereum is priced at $1168 and has fallen under its 2017 all time high price located at $1419. Since then ETH has found some short term support at its 2017 highest candle body closes, which all coincide with its weekly 200 moving average, similar to Bitcoin.
If this level does not hold up as support the next area that I would expect to act as support would be in the $700-$800 area. Just like BTC, I believe waiting to see how price action plays out for ETH is a better strategy than blindly buying the 200 week moving average and hoping that price stays above it.
Ethereum maintains price above the current candle body support level and/or the weekly 200MA support level on a weekly closing basis and that would show signs of strength.
Ethereum does not hold these support levels and pushes down to its next support level located around the $700-$800 area.
https://www.tradingview.com/x/8Eh3yhN9/
https://www.tradingview.com/x/sBuBJ97U/
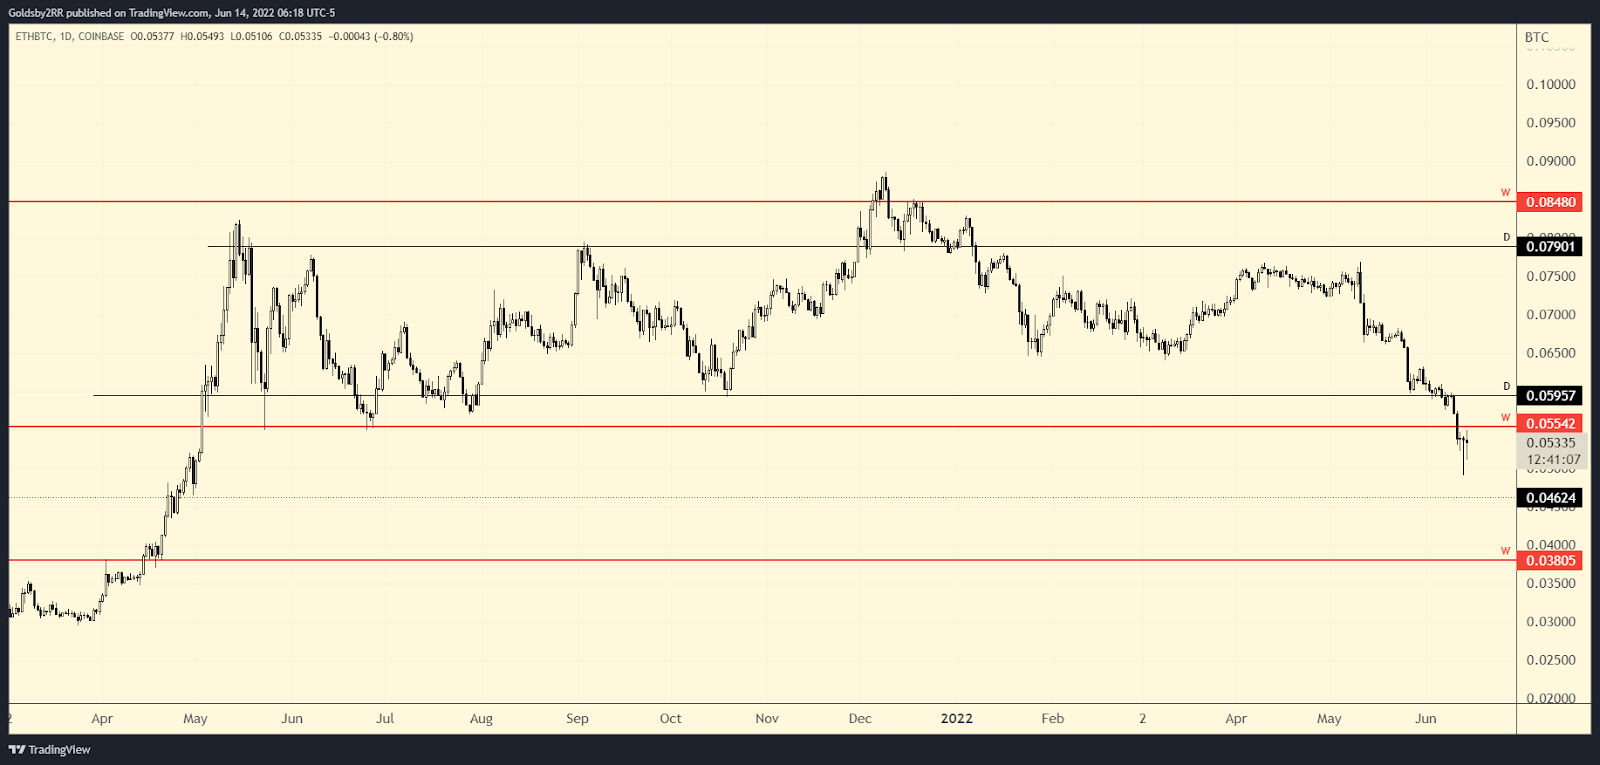
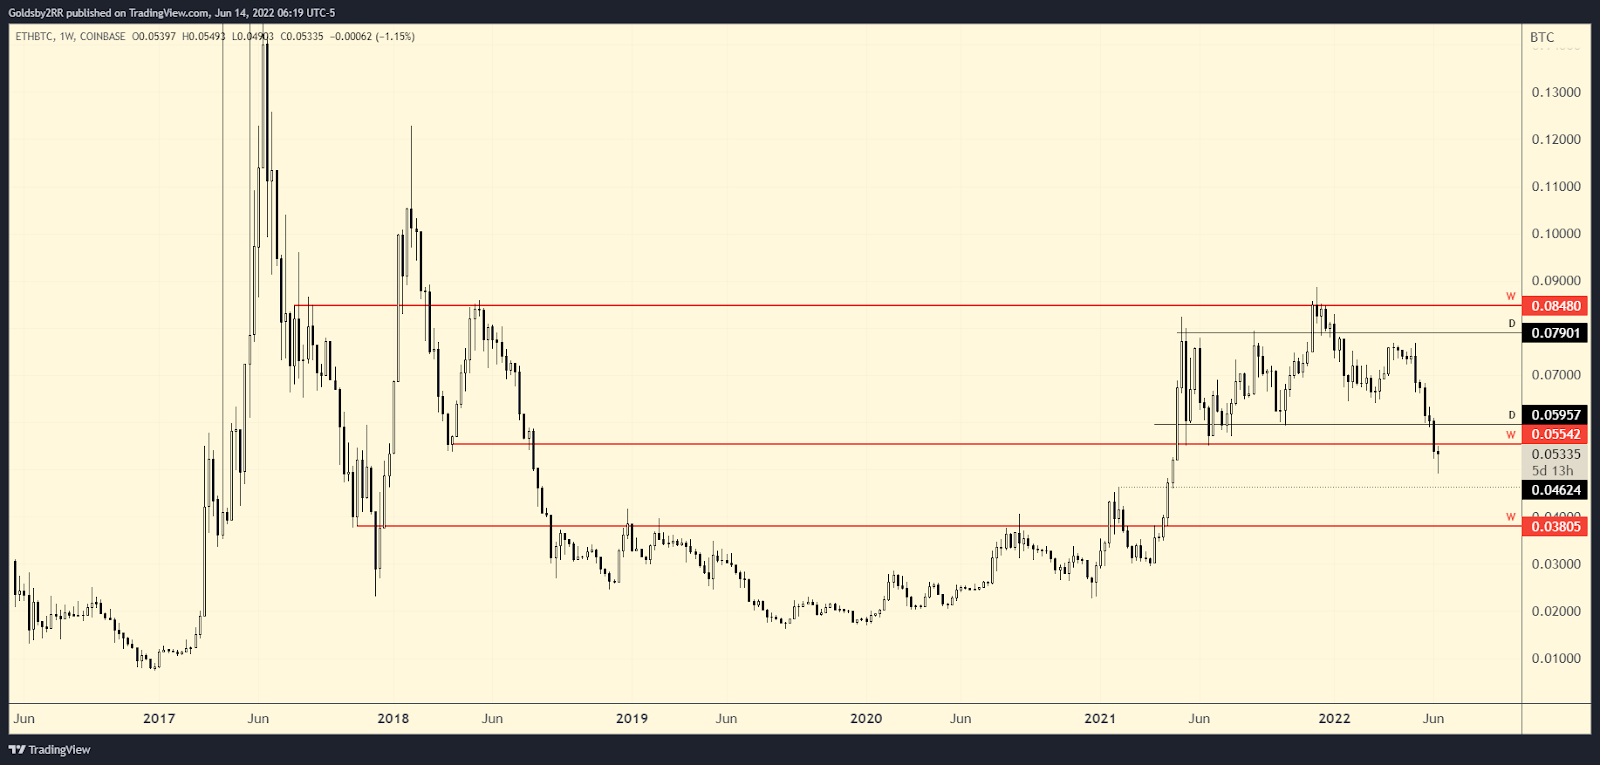
At the time of writing, ETH/BTC is valued at 0.05337. Price could not hold the high time frame range support level at 0.055BTC, and now that level is expected to act as resistance.
The next level that I am personally looking at if ETH does not reclaim the 0.055 level against bitcoin is the midpoint level located around 0.046BTC. If ETH cannot reclaim the previous range support level I would ultimately expect price to eventually find its way down to the 0.038 level in the coming weeks to months.
Ethereum reclaims the weekly support level located at 0.055BTC and I believe altcoins could see some relief
Ethereum does not reclaim the level and ETH/BTC pushes down to the 0.038 level