


https://www.tradingview.com/x/jUhdmPpe/
https://www.tradingview.com/x/qUCwU90X/
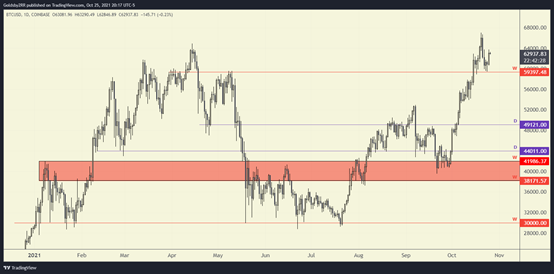
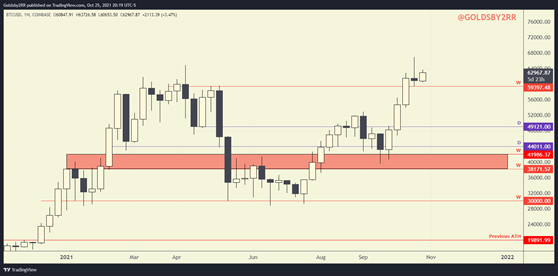
Since the last article, Bitcoin has managed to rise to $67k and retrace back to its current price of $63k. This move has created speculation around the topic of Bitcoin creating a double top pattern.
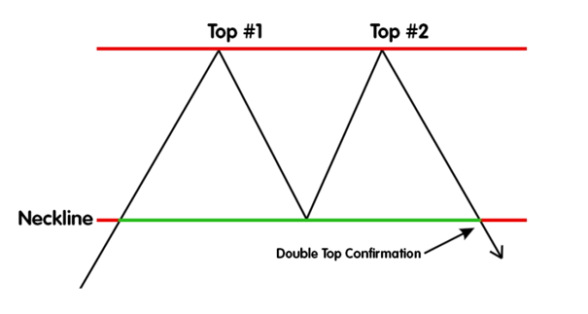
A double top is formed when a chart pattern reaches a high twice and fails to break out or create a higher high during the 2nd attempt. The pattern has two peaks that are nearly the same size and has a bottom between them. This is considered a bearish reversal pattern.
I personally do not believe this is a double top pattern. I am in the belief that while last week’s candle HIGH did reach similar highs from April, the low of the weekly candle was just retesting the old resistance at $59k as weekly support.
Bitcoin stays over the weekly $59 – $60k level and pushes beyond the last ATH.
Bitcoin loses the weekly support level. Losing this level would turn it back into resistance and I would look for $53K – $55K to function as support. In this scenario I would reconsider the double top argument.
https://www.tradingview.com/x/S0GHMoxz/
https://www.tradingview.com/x/0UzUZi8L/
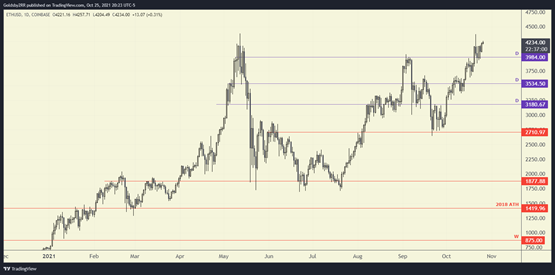
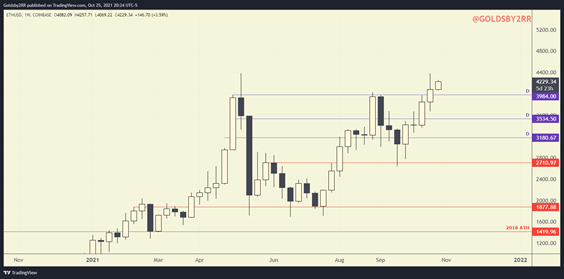
Ethereum is playing the same game as Bitcoin and also fits within the double top narrative. May’s ATH was about $4384 and the highest price $ETH has seen over the past few days was about $4374. Ethereum has not retested its last weekly resistance level as support the way Bitcoin did and it’s hard to tell if it will or will not retest the level. I would expect the $3.9k level to function as support if price were to pull back in the coming days.
Ethereum maintains price over the $3.9k level and stays in up only mode.
ETH/USD losing the $3.9k area would be the bearish scenario. If we lost this area, I would expect for $3.5k – $3.7k area
to hold up as support.
https://www.tradingview.com/x/DGcoqVWi/
https://www.tradingview.com/x/uIvaBBHi/
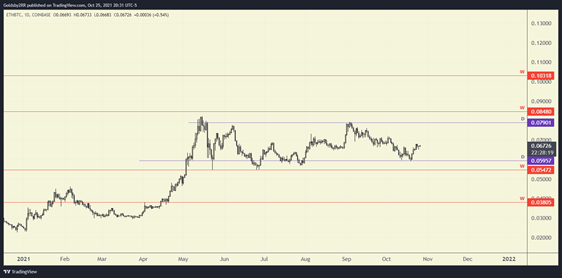
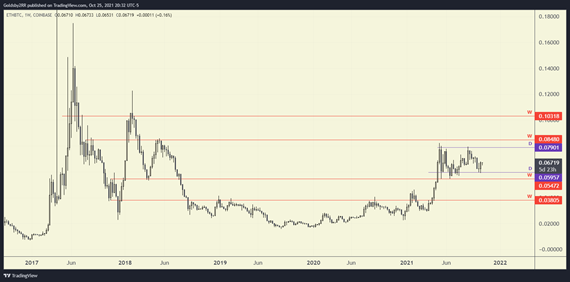
On the daily timeframe, ETH/BTC seems to be stuck in a range or in its final accumulation mode before liftoff. Ethereum has been ranging back and forth between about .06 & .08 $BTC since May this year. If/when this range is broken to the upside, I would expect Ethereum and altcoins to start outperforming Bitcoin.
Ethereum maintains price over the 0.06 BTC level and pushes through the daily resistance range level at 0.079 and then breaks the weekly level right above it.
ETH/BTC losing the 0.06 BTC level would be the bearish scenario. If we lost this area, I would expect for the 0.054 BTC weekly level to hold up as support.